
By Invitation
Golden Rule II – Planogram and Processes for Replenishment of Non-fast movers


LRN has worked at senior level positions in companies like Eicher Motors, Hero Motors, Greaves Cotton, Ashok Leyland, and Hindustan motors. His last employer was Titan Company limited. Eleven years in Titan Company limited (eight years in Tanishq) and retired as CEO for the new business division. LRN was also heading the innovation council at Titan and was an active member of Tata Group Innovation Forum.
LRN had successfully spearheaded the TOC implementation in Tanishq retailing.LRN had started a school for Innovation in Titan and the school had produced over 400 trained innovators.
LRN also undertakes consulting assignments from corporate companies on Strategy, Retail excellence and Innovation. He has recently authored two books, a book on Innovation titled “The 9 Nuggets of Innovation” and a book on retailing titled “Demystifying Retail” – The Four golden rules.

Prabhakar Mahadevan, Founder Director of Strategy and Systems Consulting & Focus and Flow
Technologies Pvt Ltd
Prabhakar is a certified Theory of Constraints consultant (TOC) by Goldratt Schools Israel, certified expert on TOC by TOCICO (www.tocico.org) & is associated with TOC for the last 22+ years.
Through his consulting companies,Prabhakar and his colleagues are involved in several comprehensive TOC consulting projects across several industry verticals such as fashion jewellery, fast moving consumer goods, consumer durables, automotive OEM, capital machinery, pharmaceutical, heavy engineering, fashion retail etc.
In continuation of our article titled “The Four Golden Rules for securing retail excellence”, we am detailing through this article, the second Golden Rule: “Planogram and Process for Replenishment of Non- fast movers”.
While this article will detail the insights in to building an Ideal Planogram, we will be delving on “Replenishment of Non-fast movers” in our next article.
1. Background
A retailer carries varieties of merchandise covering all categories, subcategory, sizes, and price points covering the width and depth of requirements of his customer base. He is investing in the stock he holds, and the return on his investment comes from the sale of merchandise.
Planogram, meaning the stock mix of the inventory held, is the backbone of retail. The right width and depth of merchandise one holds is a key factor in determining his ROI. For getting this aspect right, one should engineer their planogram. Also, when you are holding less inventory, the lost sale opportunity increases because of walkouts. When you are holding more inventory, because of “Choice Overload” the walkouts will again be high.
The retailer should find a solution to the following two questions:
- Firstly, how does one arrive at the right mix of inventory, leading to right planogram?
- Secondly, how should the retailer go about replenishing the merchandise against sale, in continuing to enjoy the right mix in planogram?
2. Constructing the Ideal Planogram
To explain this better, let us assume a retail chain with 50 showrooms. The retail chain comprises, say, 10 small format showrooms, 30 medium format showrooms, and 10 large format showrooms. The inventory mix in all these showrooms happens initially keeping their competition as bench mark. Once the showroom starts selling the merchandise, there would be learning, and each franchisee/ Store Manager uses their interpretation of the sale pattern, to correct the stock mix. Over a period, they reach a situation where they realise that the only way to bring in fresh/new merchandise is by liquidating the aged/non-selling stocks at a high discount. By resorting to this, not only their margins get eroded, but more importantly, their valuable time gets consumed only in liquidating the non-performing stock.
- What is the way out? Are there smarter processes in arriving at the right inventory mix?
- Well, it is said that collective wisdom is better than individual expertise.
In KAUN BANEGA CROREPATHI, research says that the right answers the person sitting in the Hot seat could get from “ask the expert lifeline” was only 40%, as compared to 80% correct answer from audience poll. This reiterates the point that collective wisdom is better than individual excellence. The point I am trying to make here is that, is there a way the collective happenings at each of the store can be used as a reference in arriving at the right planogram (rather than each store deciding on their planogram independently)
In the example explained, we said that the retail chain has 10 smaller format showrooms. Let us say that these small format retailers are dealing with 10 categories (and each category with multiple sub-categories) say A to J, and each category/ Sub-category will have merchandise at (say) 10 different price points, say 1 to 10. While each category (A to J) and its sub-category with price points 1 to 10, represents the width of merchandise, the depth of merchandise is defined by the number of varieties they carry in each category/ Sub- category at each price points.
Having understood thus far, we should compute the average stock held by these 10 stores, by compiling store-wise, at each category/ Sub-category/ price point wise, stock held. This followed, in arriving at the average sale, by compiling the sale, again showroom-wise, category/Sub-Category price-point-wise.
Having done this, we will be able to arrive at category-wise/sub-category wise/price-point-wise, the average sale per year of all stores together and the average stock turn, again category-wise/Sub- category wise/ price-point-wise. The sample data thus compiled will provide a valuable insight to each showroom on how their stock mix is performing in comparison with other stores and where it needs correction, and how they can arrive at the right planogram.
For a better understanding, let us consider the following example wherein for one category (Bangle)/ Sub- Category (Filigree), at one price point (10 -12 grams), compilation has been done.

This exercise needs to be done for all the Category/ Sub- Category and at each weight band. With this done, the Four- Quadrant tool (as explained below) will guide the retailer in arriving at the right assortment planning for his stores.
3. The Four Quadrant tool
This is a 2*2 analysis, which compares the sale and stock turn of a given Category/ Sub- Category/ Price point of a store with that of the group average sales and group stockturn of the group. The group average sale is captured on the Y axis and the Stock turn on the X axis. (As depicted below)
The stores falling under Quadrant 1 (Low sale and Low stock turn) and Quadrant 2 (High sale and low stock turn) are the candidates where there exists potential for stock reduction. In similar breadth, the stores falling under Q3 (High stock turn and Low sales) and Q4 (High sales and Stock turn) are the line items where they are doing well, and if required the stock can be added in the line items falling under these quadrants.
Now, coming back to the Bangle/ Filigree/ 10 to 12 grams, compilation chart done for the 10 Stores, with quadrant analysis done, will appear as below
The suggestion from our experience is that for the stores falling under Q1 and Q2 (in the above chart) the stocks can be reduced to the extent of matching the Group stock turn, without affecting their current sale.
As an example, let us look at the store 9 which is in Q1, with a sale of 2400 grams, stock of 1200 grams and stock turn of 2. If store 9 is to achieve at least the group stock turn of 2.8, their stock should be 2400/2.8 =857 grams, meaning a reduction of 343 grams (1200-857) in inventory.
The new assortment plan for a given store can be made ready by repeating the above exercise for all the line items (at Category/ Sub- Category/ Weight bands) and correcting (reducing) the stocks for the line items falling under Q1 and Q2.
The corrected inventory mixes thus arrived at is called the RIGHT/ IDEAL PLANOGRAM.
Four quadrant analysis for small retailers (< than 5 stores)
In this case, since a detailed line- item wise comparison across stores may not be meaningful (since the number of stores are less), they are suggested to do the analysis store wise, for each line item using the Four quadrant chart depicted below

For such small retailers, store wise line item wise (at the Category/ Sub-category/ weight band level) the performance of sale and stock turn is to be compared with Category/ Sub-category level average sale and Stock turn.
Having arrived at the right planogram, the next challenge will be to improve the merchandise mix on an ongoing basis, with the right replenishment process.
4. Replenishment Process (for large retailers)
For the merchandise selling under the category of fast-mover, we had explained in the earlier article how the replenishment is to be done. I will explain here, the methodology to be followed for replenishment against sale of a non-fast-mover.
To implement the suggested process, the pre-requisite lies in creating a Design bank. Therefore, let us first try and understand everything about the Design bank.
- What is Design bank?
- What should be the size of a Design bank?
- What are the pre-selection processes for a design to appear in the design bank?
- The process of replenishment using the design bank
- The advantages of using the design bank
- How to keep the design bank Dynamic?
5. Design Bank
What is a Design bank?
A design bank is a collection of pre-selected designs (with three agencies short listing) to improve the probability of sale. The design bank should cover all the line items (Category/ Sub- Category/ Weight band level = Line item) appearing in the largest show room in the retail group
What Should be the size of Design bank
To arrive at this number, for the largest store, one should refer to the sales from non-head age band, line item wise for the last one year. Having done this, the design bank should have options to cover, line item wise 6 months sale. For example, for a line item, Bangle/ Filigree/ 10-12 grams, the sale from non-head age band is 40 in a year, the design bank should have 20 varieties of design.
The computation as per the example given above must be done for all the line items appearing in the Ideal Planogram of the largest store.
If the 6 months requirement for some of the line item is less than 3, the design bank should have a minimum of 3 design variants.
What are the selection processes for a design to appear in the design bank
For a given line item if the computed number of designs to appear in the design bank is 20 (1x), then the vendor base should be asked to showcase 60 designs (3x). These 60 designs should be reviewed by the Senior store staff and the senior merchandiser in bringing it down to 40 (2x). The shortlisted 40 designs again need to be filtered through a customer meet in picking the final 20 (1x) designs to be showcased in the design bank. By repeating this process for all the line items the design bank can be made ready with a set of designs with much higher probability of selling.
The Process of replenishment using the design bank
Once the design bank is in place, all the stores should replenish their line- item wise non-head sale only from the design bank. It is important for the store to replenish the line item sold (at Category/ Sub- Category/ Weight band level) only with the similar variant belonging to the same line item from the design bank. Example: if a design variant belonging to Bangle/Filigree/10-12 grams has got sold in the non-head age band, then the store should pick an alternate design variant from design options listed under Bangle/Filigree/10-12 grams and under other category/sub-category / weight bands.

Also, there should be appropriate software (or excel) for capturing each design variant wise pick and sale from the design bank (as and when designs from design banks are picked against sale of a variant from non-head age band happens). Over a period, design bank will have line item wise/ variant wise pick and sale data which will be a valuable guide for stores in selecting the variants with higher probability of sales.
The advantages of using the design bank for replenishing sale from non-head age band
How to keep the design bank dynamic
After computing the design bank size and selecting designs based on multi-tiered selection process explained above, retailer should build the design bank with first with 50% of the design variant requirement. After this, every alternate month, 17% of design bank size should be added. But doing this, the design bank requirement will be met by the end of 6th month. From the 8th month onwards, when new designs equivalent to 17% of design bank size is added, the same number of non-performing designs from the design bank should be removed. This process ensures the design bank is kept dynamic and its size would also be around (after addition and deletion) the 6-month non-head sale requirement.
Example: Design bank size for Bangle/Filigree/10-12 grams is 50 designs. In month 0, build the design bank with 25 designs and get started with doing alternate replenishment from the design bank. In months 2, 4, and 6, add 8 new designs to the design bank. So, by the end of month 6, design bank size would be 49. In month 8, when 17 new designs are added, remove 17 old non-performing designs which was added in month 0. Repeat this process every alternate month and keep the design bank fresh and dynamic.
Summing up
To achieve the best inventory effectiveness, besides the processes suggested for fast-movers, two things are to be done:
- One must arrive at the right planogram, by doing 2 X 2 analysis
- A Design Bank showcasing merchandise-wise unique designs should be made visible to showrooms ((along with sales and pick data). This will enable the individual showrooms to pick the merchandise with good sales history, when a non-fast-mover sells.
Happy Retailing
L.R. Natarajan
M. Prabhakar


By Invitation
From Prompt To Pendant: How AI Is Turning Jewellery Buyers Into Designers
By Dr Sandip P. Dhurat

Not long ago, jewellery design was largely a one-way conversation. Consumers browsed catalogues, visited stores, or selected pieces from showcases. If they wanted something custom-made, they relied on the jeweller’s sketches, imagination, and expertise.
Today, a new collaborator has entered the room: Artificial Intelligence.
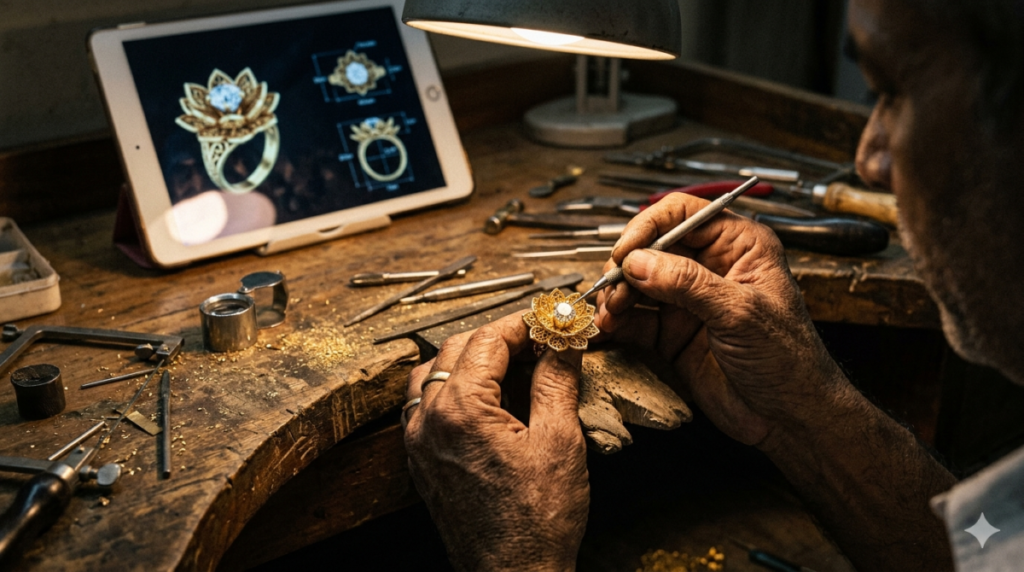
Across age groups, consumers are experimenting with AI-powered image generators and design applications to create jewellery concepts that reflect their personal tastes. A few words typed into a prompt—”an emerald engagement ring inspired by lotus petals” or “a contemporary mangalsutra with geometric motifs”—can generate multiple design possibilities within seconds.
What happens next is perhaps the most interesting part of the story.Instead of ordering these pieces online, many consumers are taking their AI-generated designs to the one person they trust most: their family jeweller.
The new wave of customisation
For decades, customization in jewellery was often limited to engraving names, changing gemstones, or making minor design alterations. AI is expanding that possibility dramatically.
Consumers are no longer arriving at jewellery stores with vague ideas. They are walking in with detailed visual references generated on their smartphones. Some have experimented with dozens of versions before settling on a favourite. Others blend elements from different designs to create something entirely unique.
In a sense, AI is democratizing the design process. It allows consumers to participate creatively, even if they have no formal design background.
For younger buyers especially, this level of involvement is appealing. They want jewellery that feels personal, expressive, and different from what everyone else is wearing. AI gives them a playground where they can explore possibilities before making a purchase.
Role of traditional family jeweller
If AI can generate designs so easily, does that diminish the role of the jeweller?Quite the opposite.
While AI can create attractive images, it cannot determine whether a design is structurally sound, comfortable to wear, practical to manufacture, or durable enough for daily use. A ring that looks spectacular on a screen may be impossible to cast. A delicate bracelet generated by AI may not withstand regular wear.
This is where the expertise of the jeweller becomes invaluable.
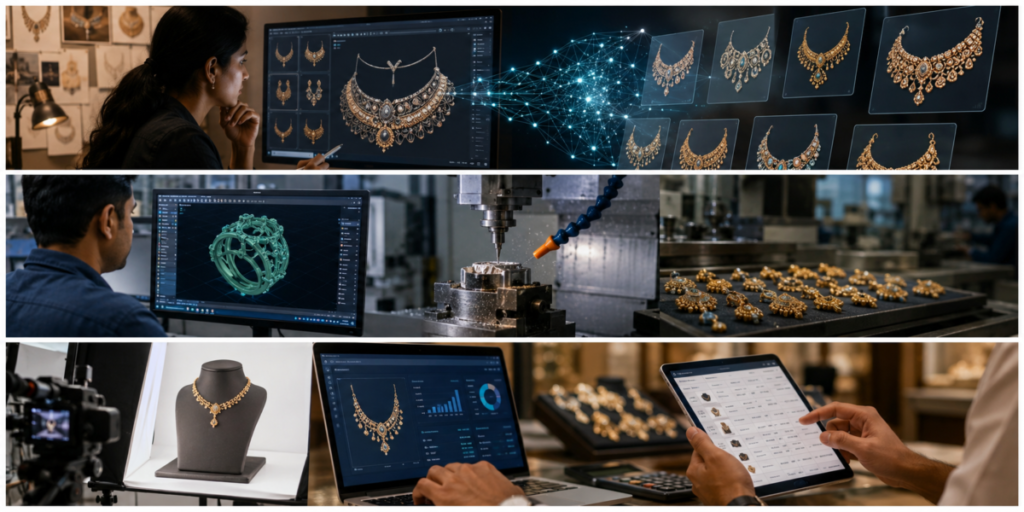
Family jewellers are increasingly acting as interpreters between digital imagination and physical reality. They assess AI-generated concepts, refine proportions, suggest technical modifications, and ensure that the final piece balances aesthetics with craftsmanship.
Many jewellers describe the process as similar to working with a client-provided sketch—except the sketch is now more sophisticated and visually detailed.
The trust factor remains unchanged. Consumers may discover designs through AI, but they still want someone they know to guide the process and stand behind the finished product.
New collaboration trend
The relationship between customer and jeweller is evolving from buyer-and-seller to co-creators.
Consider a young couple designing an engagement ring. Instead of selecting from existing collections, they use AI to explore various combinations of settings, gemstones, and motifs. They then sit down with their jeweller to discuss feasibility, budget, stone availability, and craftsmanship.
The final piece is neither entirely AI-designed nor solely jeweller-designed. It is the outcome of a collaborative journey.
This shift creates opportunities for jewellers to engage customers more deeply. Conversations become richer because customers arrive with visual ideas rather than abstract descriptions.
In many cases, the design process becomes part of the emotional value of the jewellery itself.
The opportunity
The trend presents several advantages for jewellers willing to embrace it.
First, AI-generated concepts can serve as conversation starters. Instead of spending significant time understanding a customer’s vision from scratch, jewellers can begin with a visual reference and refine it together.
Second, it can increase demand for bespoke jewellery. Consumers who might never have considered custom design are discovering how accessible it has become.
Third, it opens the door to a new generation of buyers who value individuality over mass-produced designs.
Rather than competing with AI, jewellers can position themselves as the experts who transform digital concepts into heirloom-worthy creations.
Despite all the excitement around AI, jewellery remains an intensely human product.
A necklace gifted on a wedding day, a ring marking an engagement, or a bracelet passed down through generations carries emotions that no algorithm can replicate. AI may help generate ideas, but it cannot understand family traditions, cultural significance, sentimental stories, or the subtle nuances of personal taste.
Consumers are discovering designs through technology, but they are still seeking reassurance, expertise, and craftsmanship from people they trust.
Perhaps that is the real story behind this trend.
AI is not replacing the jeweller. It is empowering consumers to participate in the creative process while making the jeweller’s role even more valuable. The screen may provide the inspiration, but it is the skilled hand of the jeweller that transforms a digital concept into a treasured piece of jewellery.
In the years ahead, the most successful jewellers may not be those who resist AI, but those who embrace it as another tool in the ongoing art of personalization—where technology sparks the idea, and craftsmanship gives it life.


QWEEN Partners With Perfect Corp. to Launch Hyper-Realistic AI-Powered Virtual Jewellery Try-On in India

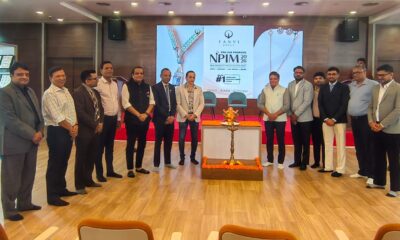
Novel Jewels’ Aneesh H. Kumarr Inaugurates Tanvi Group’s NPIM 2026 At Bharat Ratnam Mega CFC

Master Chains N Jewels Files DRHP With SEBI For ₹400 Crore IPO
Master Chains N Jewels Files DRHP With SEBI For ₹400 Crore IPO

Kalyan Jewellers Unveils Akshaya Thanga Maligai (ATM) As Its First Regional Brand; Sivakarthikeyan Named Brand Ambassador

Precious Metals Gain As Crude Prices Weaken
-
 National News8 hours ago
Master Chains N Jewels Files DRHP With SEBI For ₹400 Crore IPO
-
 BrandBuzz3 days ago
Kalyan Jewellers Unveils Akshaya Thanga Maligai (ATM) As Its First Regional Brand; Sivakarthikeyan Named Brand Ambassador
-
 International News8 hours ago
Precious Metals Gain As Crude Prices Weaken
-
 National News8 hours ago
Novel Jewels’ Aneesh H. Kumarr Inaugurates Tanvi Group’s NPIM 2026 At Bharat Ratnam Mega CFC