
International News
WGC Gold ETF Commentary : US leads multiyear record inflows

February in review
Global physically-backed gold ETFs1 saw significant inflows in February totaling US$9.4bn, the strongest since March 2022. North American flows flipped positive following two consecutive monthly outflows, recording one of its strongest months on record. Asian demand was also strong while European inflows narrowed. We have now seen three consecutive months of strong global inflows which, combined an upward trending gold price, have lifted total assets under management (AUM) to US$306bn, another month-end peak. Meanwhile, holdings rose to 3,353t, the highest month-end level since July 2023.
Highlights
- Global gold ETFs saw continued inflows during February as holdings across all regions grew.
- The third consecutive monthly inflows lifted global gold ETFs’ total AUM and collective holdings by 4.1% and 3.1% respectively in the month.
- Global gold trading volumes kept rising: OTC markets led the charge.
Regional overview
North American demand surged in February, adding US$6.8bn. This was the largest single month inflow for the region since July 2020 and the strongest February ever. As physical shipments into COMEX vaults from London and other markets made headlines, the positive gold market momentum also benefited North American gold ETFs.
But there were other important contributors. For instance, US Treasury rates trended down with various economic signals flashing red.3 Lower yields, alongside a weaker dollar, boded well for the gold price during most of the month – in fact, it reached nine new record highs in February before moving lower in the latter half.4 We believe reduced opportunity costs and a record-shattering gold price were key in attracting inflows. Moreover, a pullback in equity markets and fears of stagflation were also likely positive drivers of demand. Lastly, we have observed significant inflows triggered by gold ETFs’ options expiry, signalling further bullish sentiment from investors.
While we would not be surprised to see a slowdown in momentum, ongoing recession concerns and policy uncertainties – geopolitical and economic – will likely continue to provide a supportive floor for demand.
Gold trading volumes rise Trading activities across global gold markets increased in February, ending the month at roughly US$300bn/day on average. OTC trading, dominated by the LBMA, rose further, as dealers moved gold in response to the US tariff concerns. Gold futures trading volumes at COMEX were down while Shanghai Futures Exchange saw a sizable increase, given the strong local gold price performance. Additionally, gold ETF trading activities also rose, led by North America.


International News
GJEPC Steps Up UK Outreach Ahead Of IIJS Bharat Premiere 2026
GJEPC Visited Major Jewellery Trading Hubs, Meeting 20+ Jewellery Retailers and Wholesalers Through In-Person Interactions
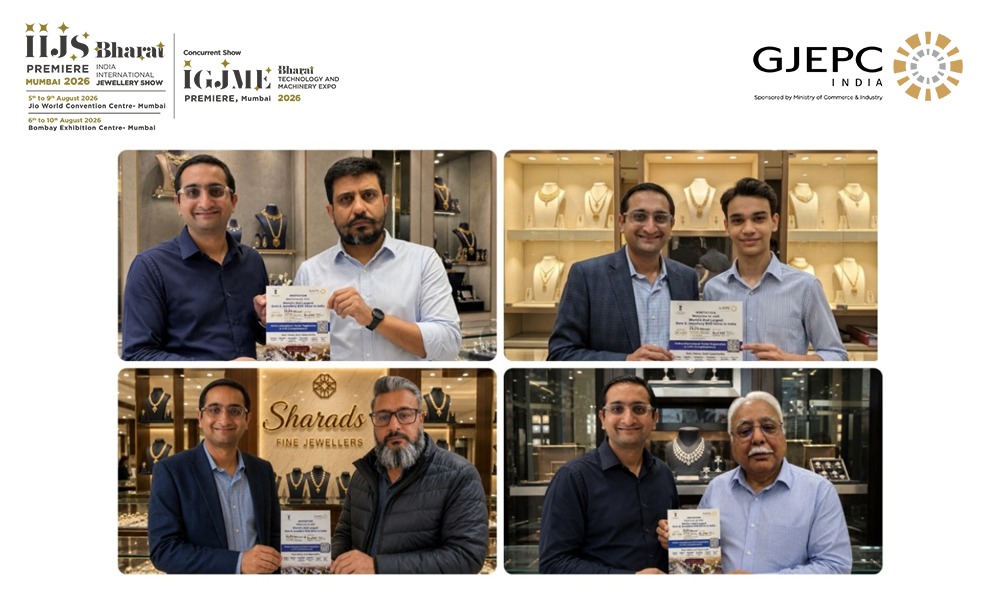
GJEPC intensified its promotional efforts in the United Kingdom ahead of IIJS Bharat Premiere 2026 through a week-long outreach programme in London that combined direct retailer engagement with the 2nd India-UK Jewellery Buyer-Seller Meet (BSM). The initiative was held from 6 to 10 July 2026 and aimed to attract more UK buyers while strengthening trade ties following the India-UK Free Trade Agreement.
As part of the campaign, Gaurang Vora, Manager, GJEPC, visited major jewellery trading hubs including Green Street, Southall and Wembley, meeting 20+ jewellery retailers and wholesalers through in-person interactions. He promoted IIJS Bharat Premiere 2026, distributed event information and registration details, and gathered market feedback on sourcing requirements and buying trends.
Based on feedback from UK buyers, the 2nd India-UK Jewellery Buyer-Seller Meet generated strong demand for 22-karat gold jewellery, diamond jewellery, lightweight designs, lab-grown diamond jewellery and silver jewellery. Buyers also expressed interest in sourcing from reliable, export-oriented Indian manufacturers and suggested that suppliers offer smaller minimum order quantities to better meet the needs of independent retailers.
The campaign generated new buyer enquiries, strengthened relationships with existing trade partners and provided GJEPC with market intelligence on consumer preferences and sourcing trends. The Council plans to continue engaging with buyers, assist with IIJS Bharat Premiere registrations and facilitate introductions between overseas buyers and Indian manufacturers.


Kushals Turns The 9-To-5 Into ‘9 To Shine’ With Its Workwear Jewellery Collection Featuring Real Life Professionals

GJEPC Drives Nationwide Push For First India-UK CETA Jewellery Shipments

Gold Slips Below Rs 1.45 lakh On MCX As Middle East Tensions Rise
-

 New Premises1 day ago
Iconic Actress Tabu Unveils Kalyan Jewellers First Showroom In Baramati
-

 BrandBuzz8 hours ago
Malabar Gold & Diamonds Announces ‘Ashada Shubha Labh’ Festive Offers Across Karnataka
-
 National News5 hours ago
Gold Slips Below Rs 1.45 lakh On MCX As Middle East Tensions Rise
-
 National News5 hours ago
GJEPC Drives Nationwide Push For First India-UK CETA Jewellery Shipments