
International News
Physical Silver investment increasingly important to global silver demand
Market Trend Report on the Key Physical Silver Investment Markets report examines the leading global physical silver markets: the United States, India, Germany, and Australia.
Physical investment is a structurally important part of global silver demand, and the most volatile. Notably, over the past 15 years, physical silver investment has ranged between a low of 157.2 million ounces (Moz) in 2017 and a record high of 337.6 Moz, established in 2022. With growing geopolitical tensions, rising government debt, and an increasing investor perception that silver is undervalued compared to gold, the silver price has experienced a 34 percent year-to-date increase. By comparison, the white metal is outperforming gold, which is up 28 percent, and Bitcoin, rising 18 percent year-to-date.
To gain a deeper understanding of this critical demand center, the Silver Institute commissioned Metals Focus, a leading precious metals consultancy based in London, to produce a new Market Trend Report on the “Key Physical Silver Investment Markets.” The report examines the leading global physical silver markets: the United States, India, Germany, and Australia.
Key points from the report include:
The United States
- The scale of US buying has been astounding, with a combined total of 1.5 billion ounces (Boz) of silver purchased by retail investors between 2010 and 2024.
- The value of US silver physical investment has averaged around 70% of the value of gold investment purchases, compared to just 6% in the rest of the world.
- Investment in Individual Retirement Accounts (IRAs) remains a significant part of US physical silver investment. However, precious metals account for a small share of the total IRA market, offering considerable room for IRA silver demand to grow further.
- Through late 2023, there was an exceptionally low level of retail liquidations, but these have increased since then. Even so, US investors still hold much of the 1.5 Boz acquired over the last 15 years.
India
- India is the second-largest physical silver investment market, but it has occasionally eclipsed the US, which has traditionally been the largest physical silver market.
- The country has a long-standing tradition of owning physical silver, typically in the form of silver bars, which in 2024 comprised 70% of total retail demand.
- Attractive local prices helped boost retail silver investment up 21% in 2024
- Between 2010 and 2024, the cumulative demand for Indian bars and coins totaled 840 million ounces. Even at today’s higher and sometimes record-setting rupee prices, the scale of selling back has been surprisingly modest.
Germany
- Germany has long held the position of the third-largest market for retail silver bar and coin investment, a market that has been volatile in recent years, with physical investment averaging 48.5 million ounces (Moz) from 2020 to 2022.
- The German physical silver market has long been dominated by bullion coins, accounting for roughly 80% of the market.
- However, the end of favorable tax treatment at the end of 2022 has weighed on the German physical silver market, with German net silver demand slumping by 39 million ounces (Moz) since 2023, and the gold market also seeing a sharp decline.
- This year has seen a partial recovery supported by ongoing economic and geopolitical uncertainties, with a forecasted 25 percent year-over-year increase in physical silver investment demand in Germany.
Australia
- Australia has emerged as the world’s fourth-largest physical silver market in recent years.
- As recently as 2019, Australian silver coin and bar demand stood at just under 3.5 million ounces. By 2022, it had surged to a record high of 20.7 Moz.
- Two factors have contributed to the growth of the Australian market: the increasing popularity of investing in silver in retirement accounts and the favorable tax structure applicable to physical silver investment products.
- Australian physical silver demand is forecast to rise by 11 percent this year as cost-of-living-related selling of precious metals eases, with inflation edging lower and interest rates falling.


International News
Israel’s Diamond Industry Hits Record Lows
From January To June 2026, Israel Exported Only $2.4 Billion In Diamonds. At Its Peak In 2015, That Figure Was Around $7 Billion—More Than Three Times Higher.
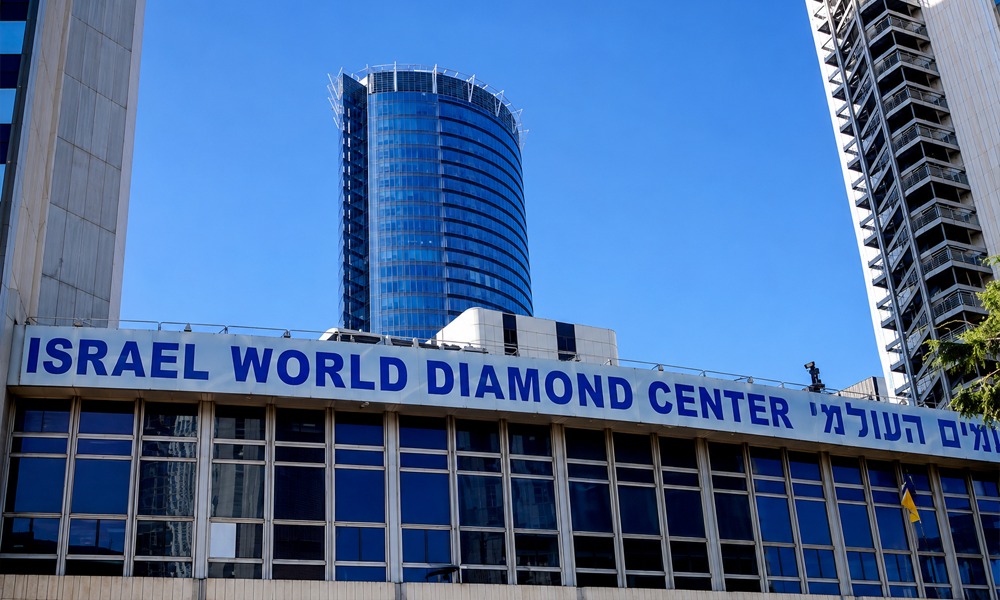
Israel’s diamond exports have dropped dramatically to their lowest levels in history. Reflecting these difficult times, the head of the Israel Diamond Exchange has announced his resignation.
Key Numbers
- Massive Drop in Exports: From January to June 2026, Israel exported only $2.4 billion in diamonds. At its peak in 2015, that figure was around $7 billion—more than three times higher.
- Total Trade Shrinking: Total industry trade (combining imports and exports) fell to $4 billion, down from $12 billion during its best years.
Why Is the Industry Struggling?
- Competition from Dubai: Dubai has become a major global diamond hub, drawing traders away from Israel with lower tax rates.
- Lab-Grown Diamonds: Man-made diamonds are significantly cheaper than natural ones, taking away a large portion of the market.
- New U.S. Tariffs: A new 10% import tax on diamonds was recently introduced by U.S. President Donald Trump. Since the U.S. buys about 20% of Israel’s diamond exports, this tax hits the local industry hard.
- Shifting Consumer Habits: Younger buyers are spending more money on experiences rather than luxury jewelry. Additionally, diamond demand in China has slowed down significantly.
Global Impact & What’s Next
The downturn isn’t just affecting Israel; it is a global issue. Even De Beers—one of the world’s biggest diamond companies—has been put up for sale for the first time ever.
Despite these setbacks, Israel still holds key advantages in the market, such as strong client relationships and deep expertise in cutting large, rare, and colored diamonds. Israeli officials are currently negotiating with the U.S. to lower the new tariffs and working with their own government for tax relief to help the industry bounce back.


JCS Jewel Creations Opens Exclusive Silver Lounge In Chennai

Israel’s Diamond Industry Hits Record Lows

WGC Gold Demand Trends Q2 2026: Gold Demand In Q2 Remained Unchanged Year-On-Year

Precious Metals Faced Mixed Signals Markets Digest Fed Stance and Geopolitical Risks

IIJS Bharat Premiere 2026, Brings Together Innovation, Craftsmanship, Technology, and International Business Opportunities Under One Roof

Laxmi Diamonds, Bengaluru: Built On Blessings, Driven By Passion
-
 National News6 hours ago
Precious Metals Faced Mixed Signals Markets Digest Fed Stance and Geopolitical Risks
-
 National News4 hours ago
IIJS Bharat Premiere 2026, Brings Together Innovation, Craftsmanship, Technology, and International Business Opportunities Under One Roof
-
 Cover Story1 day ago
Laxmi Diamonds, Bengaluru: Built On Blessings, Driven By Passion
-
 National News3 hours ago
WGC Gold Demand Trends Q2 2026: Gold Demand In Q2 Remained Unchanged Year-On-Year