
JB Insights
WGC Gold Demand Trends : Gold breaks records as investors seek shelter from market turbulence
The World Gold Council’s Q3 2025 Gold Demand Trends report reveals that quarterly gold demand (including OTC) reached 1,313t, or US $146bn in value terms and was the highest quarter for demand on record.
Growth was driven primarily by investment demand which accelerated in Q3 reaching 537t (+47% y/y) and accounted for 55% of overall net gold demand. This momentum was driven by a powerful combination of an uncertain and volatile geopolitical environment, US dollar weakness and investor “FOMO” as the price climbed higher.
Investors continued to pile into physically backed gold ETFs for a third consecutive quarter, adding a further 222t with global inflows reaching US$26bn. Year-to-date, gold ETFs have added a total of 619t (US$64bn) to their holdings with North American listed funds leading the charge (346t), followed by European (148t) and Asian funds (118t).
Bar and coin investment rose 17% y/y, totalling 316t, with growth in almost all markets but with significant contributions from India (92t), China, (74t).
On the other hand, gold jewellery demand was weighed down by 50 record gold prices this year, seeing a 19% y/y decline in consumption for Q3. While the two largest consumer markets – India and China – both saw a quarter-on-quarter uplift, largely due to seasonal factors, the y/y picture across both markets remained weak.
Central banks picked up the pace in Q3 with net purchases totalling 220t in the third quarter, up 28% on Q2 and 10% y/y, despite the record-high gold price. On a year-to-date basis, net buying totalled 634t, trailing behind the exceptional highs of the last three years, but comfortably above pre-2022 levels.
Total gold supply reached a quarterly record of 1,313t, up 3% y/y. Mine production increased by 2% y/y to 977t while recycling was up 6% y/y at 344t, staying relatively stable given the soaring gold price.

Louise Street, Senior Markets Analyst at the World Gold Council, commented:
“Gold’s climb towards US$4,000/oz in the third quarter underscores the strength and persistence of the factors that have been driving demand throughout the year. Heightened geopolitical tensions, stubborn inflationary pressures and uncertainty around global trade policy have all fuelled appetite for safe-haven assets as investors look to build resilience in their portfolios.
“The outlook for gold remains optimistic, as continued US dollar weakness, lower interest rate expectations, and the threat of stagflation could further propel investment demand. Gold has set record after record this year, and the current environment suggests there could be more upside gains for gold. Our research indicates the market is not yet saturated, and the strategic case to hold gold remains firmly in place.”
Sachin Jain, Regional CEO, India, World Gold Council said:
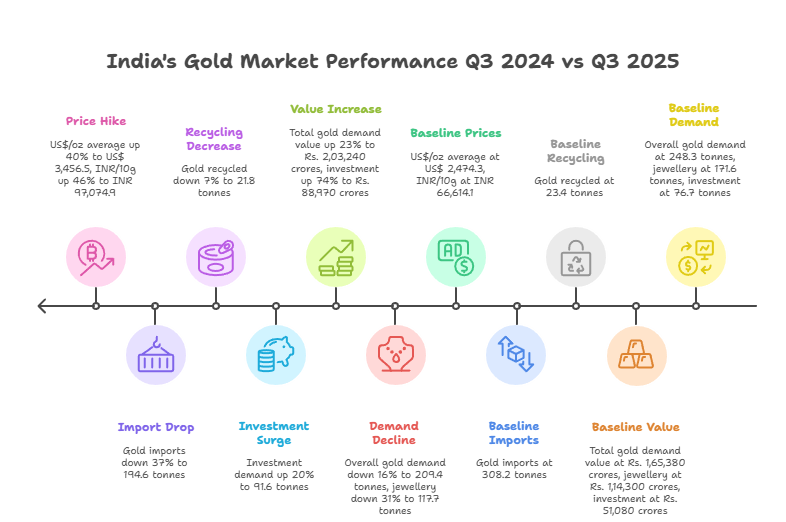
“India’s gold market in Q3 2025 showcased its inherent resilience and the significant impact of evolving price dynamics. While total gold value surged impressively by 23% to Rs. 2,03,240 crores, gold demand volumes saw a 16% decline to 209.4 tonnes. This robust growth in value, driven by high average prices, strongly reaffirms gold’s enduring appeal as a safe-haven asset. Investment demand, showed remarkable strength, increasing 20% in volume to 91.6 tonnes and a significant 74% in value to Rs. 88,970 crores.

This highlights a deepening strategic commitment among Indian consumers to gold as a long-term store of value. While jewellery demand saw a 31% volume decrease to 117.7 tonnes, its value remained largely stable at Rs. 1,14,270 crores. This indicates that despite higher prices, gold’s intrinsic cultural significance continues to drive purchases, with consumers adapting to the new price levels.
On the supply side, gold imports were 194.6 tonnes, down 37%, while recycling saw a modest 7% decline to 21.8 tonnes, suggesting consumers are holding onto their prized asset. Looking ahead, the current festive and wedding seasons are pivotal for the yellow metal. Gold’s unique cultural significance means festivals traditionally drive strong buying interest. Despite prevailing high prices, consumer sentiment remains positive, and retailers are well-prepared. We anticipate robust demand across all categories, from traditional jewellery to investment products, as the market gears up for a vibrant festive and wedding season. With total gold demand from January to September at approximately 462.4 tonnes, we anticipate full-year demand between 600 and 700 tonnes, more towards higher end of range.“
Gold Demand Trends Q3 2025 India Fact Sheet: India Gold Demand Statistics for Q3 2025 (July – September)
- Demand for gold in India for Q3 2025 was at 209.4 tonnes, down by 16% as compared to overall Q3 demand for 2024 (248.3 tonnes)
- India’s Q3 2025 gold demand value was Rs. 2,03,240 crores, up by 23% as compared to Q3 2024 (Rs.1,65,380 crores)
- Total Jewellery demand in India for Q3 2025 decreased by 31% to 117.7 tonnes as compared to Q3 2024 (171.6 tonnes)
- The value of jewellery demand remained rather unchanged at Rs. 1,14,270 crores, compared to Rs. 1,14,300 crores recorded in Q3 2024
- Total Investment demand for Q3 2025 was at 91.6 tonnes, increased by 20% in comparison to Q3 2024 (76.7 tonnes)
- In value terms, gold Investment demand in Q3 2025 was Rs. 88,970 crores, up by 74% from Q3 2024 (Rs. 51,080 crores)
- Total gold recycled in India in Q3 2025 was 21.8 tonnes, down by 7% compared to 23.4 tonnes in Q3 2024.
- Total gold imports in India in Q3 2025 was 194.6 tonnes, down by 37% compared to 308.2 tonnes in Q3 2024.
- US$/oz average quarterly price in Q3 2025 was US$ 3,456.5 in comparison to US$ 2,474.3 in Q3 2024.
- INR/10g average quarterly price in Q3 2025 was INR 97,074.9 in comparison to INR 66,614.1 in Q3 2024 (without import duty and GST)


Gold and silver ended lower on the week despite sharp intraday rebounds, with price action reflecting continued volatility and fragile positioning rather than a sustained recovery. In the absence of a definitive macro catalyst, a broad-based decline across equities and cryptocurrencies prompted investors to raise liquidity, briefly dragging gold below the key $5,000 per ounce threshold. Non-yielding assets came under pressure as earlier stronger-than-expected US employment data pushed expectations for the first Federal Reserve rate cut further into midyear, reducing the appeal of bullion. Sentiment shifted, however, after inflation data showed annual CPI slowing to 2.4% and core inflation easing to 2.5%, reviving dovish expectations. The softer inflation print weighed on Treasury yields and pressured the dollar, allowing gold to recover toward the $4,990 region. Silver experienced similar turbulence, sliding sharply during the liquidation phase before rebounding above $76 per ounce, though it remained on track for another weekly decline.

Gnanasekar Thiagarajan
Introduction:
Gold finished the period under pressure despite sharp rebounds, with price action dominated by cross-asset volatility and shifting rate expectations. After initially recovering more than 2% on softer-than-expected US inflation, bullion briefly pushed back toward the $5,000–$5,020 region as annual CPI slowed to 2.4% and core inflation eased to 2.5%, reinforcing expectations of multiple Federal Reserve rate cuts this year. Lower yields and a softer dollar provided near-term relief, reviving the structural appeal of non-yielding assets.
However, gains proved fragile as the dollar rebounded and gold slipped back below $5,020, underscoring hesitation around the psychological $5,000 threshold. Earlier strength in US labor data had already delayed expectations for the first rate cut toward midyear, capping upside momentum. Markets now await further guidance from FOMC minutes, GDP data and the core PCE print, while geopolitical developments — including renewed US-Iran nuclear talks and broader Middle East tensions — continue to shape safe-haven flows.
Silver tracked gold’s volatility but continued to underperform structurally, remaining in a corrective phase after January’s extreme surge. The metal rebounded nearly 3% on softer inflation data and firmer rate-cut expectations, briefly moving back above $76 per ounce, but gains faded as liquidity stayed thin amid China holidays and broader risk sentiment remained fragile. Heavy speculative positioning left silver exposed to sharp reversals, and prices are still far below late-January highs above $120 after the collapse toward the mid-$60s. While lower yields and debasement concerns offer underlying support, near-term trade points to consolidation rather than a swift return to the prior rally.
Gold and Silver:
Gold fell below $5,020 per ounce on Monday after rising more than 2% in the previous session, following weaker-than-expected US CPI data. The soft inflation print reinforced expectations for Federal Reserve rate cuts this year, with markets now pricing in slightly more than two reductions. Investors are awaiting the release of FOMC meeting minutes, the US GDP advance estimate, and PCE inflation data for further clues on the timing of the next rate cut. On the geopolitical front, traders are monitoring nuclear talks between the US and Iran, as well as US-led negotiations aimed at ending the war in Ukraine, both scheduled to resume on Tuesday. Developments in these areas could influence risk sentiment and safe-haven demand. Despite recent volatility, the precious metal remained supported by ongoing geopolitical uncertainty, strong central bank buying, and investor flight from sovereign bonds and currencies.
Silver March
Silver fell more than 1% toward $76 per ounce on Monday, reversing gains from the previous session, although trading volumes were subdued due to market holidays in the US, China and other countries. On Friday, the metal had jumped nearly 3% after soft US inflation data reinforced expectations that the Federal Reserve will cut interest rates later this year. Markets are currently pricing in a Fed rate cut in July, with a strong probability of a move in June. Investors now turn to the latest Fed minutes and the Fed-preferred core PCE price index report for further guidance on the US monetary outlook.
Meanwhile, mainland China’s markets are closed this week for the Lunar New Year holiday. Chinese traders had driven a speculative surge in precious metals in recent weeks, prompting authorities to curb market risks through various measures. Silver peaked above $120 an ounce in late January before falling to around $64 earlier this month as sentiment reversed.
Gold April
Technical View: $4996. Weekly chart shows a strong underlying uptrend with price holding well above the short-term moving averages and momentum expanding positively. The recent pullback appears corrective, with support seen near $4886/4878; holding above this zone keeps the broader structure intact for a move towards $5460. A decisive break below $4765 will be the first sign of deeper corrective pressure.


-

 National News4 days ago
IIBS-11: Navigating the ‘New Gold Rush’ in a fragmenting global economy
-

 International News4 days ago
Oroarezzo 2026, with Italian Exhibition Group, Manufacturing Explores New Markets
-

 International News4 days ago
Gemfields nets $53m in Bangkok ruby auction
-

 New Premises4 days ago
Limelight Diamonds Unveils Exclusive Visakhapatnam Store in the Presence of Union Minister of Civil Aviation Shri Kinjarapu Ram Mohan Naidu