
International News
Swiss watch industry sees export values up 9.2% yoy in Feb 2026, USA, Japan, France drive growth
Growth was led by high-end segments and favorable base effects, while demand in China and Hong Kong remained fragile.
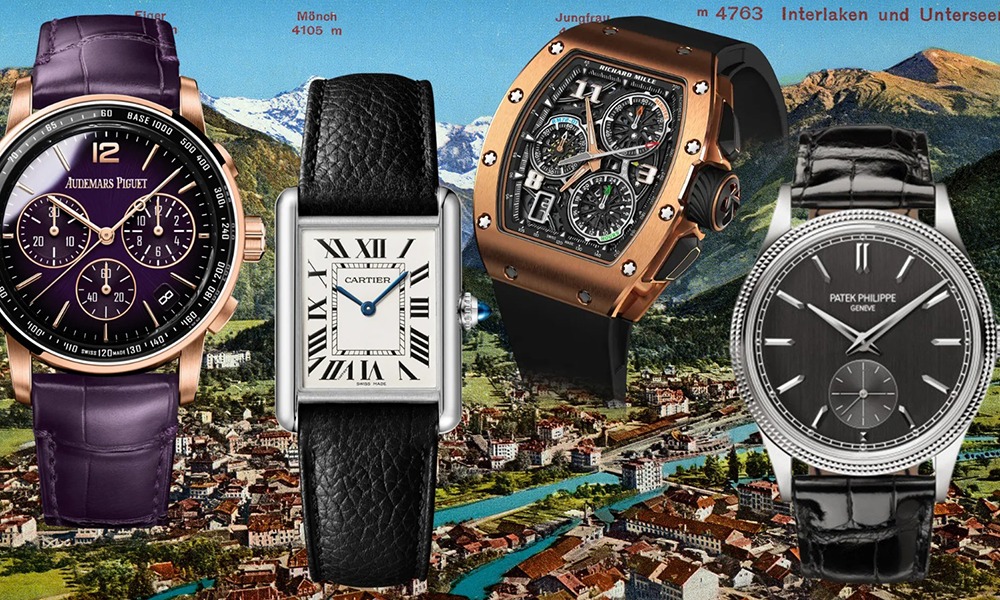
The Swiss watch industry experienced a notable rebound in February 2026, with export values climbing 9.2% year-over-year. This recovery follows a sluggish start to the year in January, where exports had dipped by 3.6%. It was mainly the very strong growth in three of the main markets – the USA, Japan and France – that tipped the balance.
According to the Federation of the Swiss Watch Industry (FHS), total monthly sales reached CHF 2.2 billion (approximately USD 2.77 billion), a significant increase from the CHF 1.9 billion recorded in the previous month.
Key Market Performance
The recovery was primarily driven by explosive growth in three core Western and Asian markets, which offset continued fragility in Greater China.
The Top Performers
- USA (+26.8%): Maintaining its position as the world’s largest market for Swiss watches, the U.S. continues to exhibit “seesaw” behavior. This volatility is largely attributed to shifting trade policies and tariff uncertainties under the Trump administration.
- Japan (+23.7%): Demand surged in Japan, marking it as a critical pillar of the February recovery.
- France (+57.1%): While appearing as the strongest growth leader for the third consecutive month, the FHS notes this likely reflects France’s role as a logistics hub. Many watches are transshipped through France to other European destinations rather than being sold to local French consumers.
The Struggling Hubs
In contrast to the Western rebound, the Asian “Greater China” region remains under pressure:
- China (-11.0%): Following a brief 5.0% uptick in January, demand plummeted again in February.
- Hong Kong (-5.2%): Similarly, the recovery seen in January (+3.6%) proved short-lived. The FHS characterized the demand in these regions as “fragile.”
Analysis of the Recovery
1. The “Base Effect”
A portion of the 9.2% growth is attributed to a positive base effect. February 2025 was an exceptionally weak month for the industry, with exports down 8.2% at that time. Consequently, the year-on-year comparison for 2026 appears more favorable because the starting point (February 2025) was so low.
2. Tariff Volatility in the U.S.
The U.S. market has become increasingly unpredictable. Watch brands and retailers have been oscillating between building up stocks to beat potential tariff hikes and pulling back during periods of trade policy shifts. This has created a “seesaw” effect in monthly export data.
3. Material and Price Segment Trends
Growth was not uniform across all categories. High-end timepieces continue to lead the charge:
- Precious Metal & Bimetallic Watches: These segments saw the strongest value increases, with bimetallic watches (gold/steel) surging by 38.4%.
- Price Tiers: Growth was most pronounced in watches with an export price between CHF 500 and CHF 3,000.


International News
GIA Celebrates America’s 250th Anniversary With Special Red, White and Blue Gem Showcase
Through This Curated Exhibition, GIA Highlights The Scientific, Historical and Artistic Dimensions Of Gemstones While Commemorating A Major Milestone In American History.
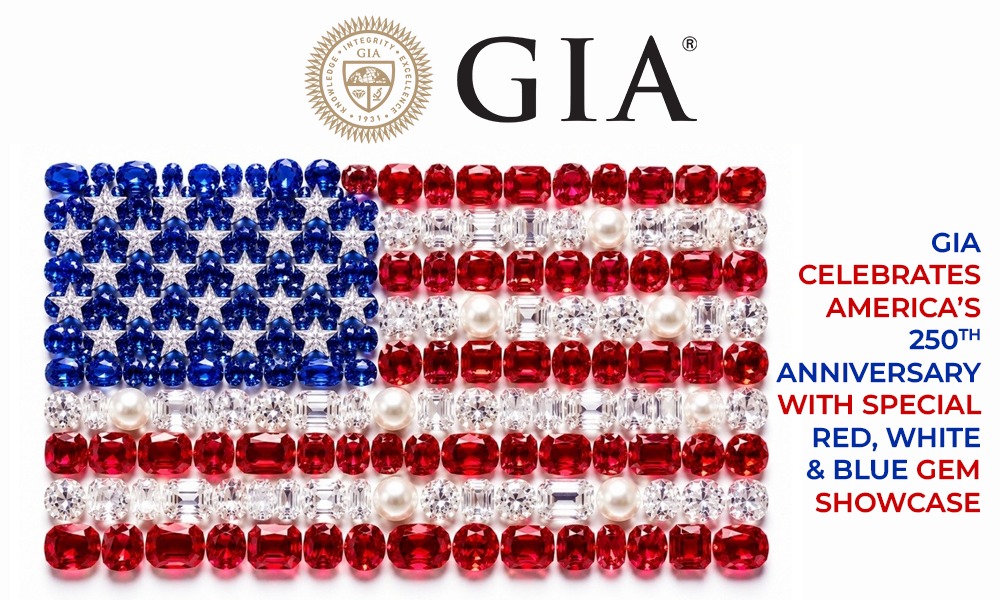
The Gemological Institute of America (GIA) has assembled a distinctive collection of red, white and blue gemstones and pearls to mark the 250th anniversary of the United States. The showcase demonstrates the remarkable diversity of gem materials and highlights how crystal structures, trace elements and natural formation processes influence colour and appearance.
The collection presents a patriotic palette through an array of rare and notable gemstones. Featured in the red category are ruby, red spinel, rhodochrosite and red beryl. A standout exhibit is a finely carved ruby portrait of Abraham Lincoln, underscoring the artistic possibilities of gemstone carving. The display also includes red beryl, one of the world’s rarest gemstones, which is commercially mined only at Utah’s Ruby Violet Mine.
Representing the white and colourless segment are zircon, beryllonite, apophyllite and pearls. Colourless zircon is renowned for its exceptional brilliance and fire, while beryllonite from Maine adds a uniquely American element to the collection. Natural pearls further enrich the display, showcasing the fascinating biomineralisation process through which they are formed inside mollusks.
The blue section features blue spinel, dumortierite, euclase and benitoite. Among these, benitoite holds special significance as California’s state gemstone. First discovered in 1907 and officially designated as the state gem in 1985, benitoite is celebrated for its vivid blue colour and striking sparkle. Despite extensive study, scientists have yet to fully determine the cause of its distinctive hue.
Through this curated exhibition, GIA highlights the scientific, historical and artistic dimensions of gemstones while commemorating a major milestone in American history.


BCCI Panel Discussion Explored Ways To Channel Household Gold Into The Formal Financial System

Thangamayil Jewellery, Tamil Nadu’s Trusted Jewellery Chain, Receives IAGES Accreditation

GJEPC Urges RBI To Ease Banking Norms To Boost GJ Exports

Indriya, Aditya Birla Jewellery, Sets A New Industry Standard With Diamonds Of The Highest Sparkle

Ministry Of Good Souls Unveils Its New Bridal Collection In Bespoke 925 Sterling Silver

Hazoorilal Legacy Debuts ‘Facets’, An Avant-Garde High Jewellery Collection
-
 BrandBuzz1 day ago
Indriya, Aditya Birla Jewellery, Sets A New Industry Standard With Diamonds Of The Highest Sparkle
-
 BrandBuzz1 day ago
Hazoorilal Legacy Debuts ‘Facets’, An Avant-Garde High Jewellery Collection
-
 National News1 day ago
Ministry Of Good Souls Unveils Its New Bridal Collection In Bespoke 925 Sterling Silver
-

 National News1 day ago
MCX Precious Metals Face Notable Selling Pressure