
International News
Gold Surge Lifts Top 50 Mining Companies to $1.4 Trillion Despite Base Metal Slump
Precious Metals Drive Market Rebound as Trade Tensions and Battery Metal Weakness Persist

A powerful rally in gold prices has propelled the combined market capitalization of the world’s 50 most valuable mining companies to $1.4 trillion, offsetting sharp declines in copper and lithium stocks amid ongoing global trade tensions.
The sector added nearly $80 billion in value in early 2025, partially clawing back losses sparked by new U.S. tariffs that rattled global markets. While the rebound marks a positive turn, overall mining valuations remain approximately $400 billion below their 2022 peak.
The rankings, based on data as of April 17 to avoid early-quarter market volatility, show precious metals leading the resurgence. Gold soared to a record $3,420 an ounce, reshaping the industry’s top tier. Gold-related firms now represent one-third of the Top 50’s total value, and six new companies — the highest quarterly addition since tracking began — entered the rankings, helping Canada surpass Australia in total miner valuations for the first time.
Meanwhile, copper miners bore the brunt of commodity headwinds. A steep decline in copper prices erased $53 billion in market value, pushing out names like Lundin Mining and Poland’s KGHM. Their exits made way for gold-focused entrants such as Lundin Gold, which doubled its valuation to $10.1 billion.
South African producers Harmony Gold and Goldfields also saw gains on the back of the gold boom, while Russia’s Polyus and Norilsk Nickel maintained their standings despite facing ongoing sanctions and limited global trading access.
In contrast, lithium’s decline was stark. Once represented by six companies in the Top 50, only Chilean miner SQM remains following a price collapse that decimated market caps across the battery metals space. Rare earth companies continued to struggle, with only China Northern Rare Earth retaining a spot in the rankings.
The changing composition of the Top 50 underscores gold’s growing dominance amid persistent economic uncertainty. With Uzbekistan’s state-owned Navoi Mining preparing for a high-profile IPO, more gold miners could join the elite ranks in the months ahead.


International News
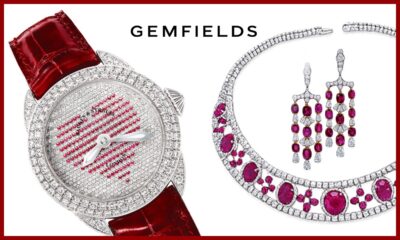
Gemfields – Ruby: The Fire Within
Gemfields Explores the Science, Symbolism and Timeless Allure of Mozambican Rubies, July’s Iconic Birthstone

This July, for which ruby is the birthstone, Gemfields is seeing red. Rubies are often regarded as powerful symbols of passion and vitality, with their blazing scarlet hue evoking feelings of hot-headed love and burning desire. Describing colour in gemstones is a little like describing the ephemeral. We can feel it, see its effects, and experience its intensity, yet the moment we try to define it precisely, language begins to fall short.
Our eyes can distinguish millions of colour variations, far more than our vocabulary can comfortably name. In emeralds and rubies, especially, what we casually call “red” or “green” is rarely just that. A ruby may show flashes of pinkish-red, orangey-red, or purplish-red depending on the light. An emerald might lean bluish-green in one moment and reveal a warmer, slightly yellowish tone in another. The human eye perceives nuances instantly, whilst words struggle to keep up.
Gemmology attempts to bridge this gap by breaking colour down into components: hue (the basic colour), tone (how light or dark it is), and saturation (how vivid or intense it appears). This structured language helps professionals communicate more clearly. Yet even then, colour remains subjective. Two people can look at the same gem and describe it differently because perception is influenced by lighting, environment, and even personal sensitivity to colour.
A ruby’s red comes from trace elements of chromium and how it interacts with surrounding oxygen ions, as this affects the rays of light that are absorbed or reflected within the crystal. Rubies from Mozambique display the full known spectrum of colour ranges, including the most vivid red hue, and naturally fluoresce under UV light.
There is, of course, another dimension to colour in rubies, in that the gemstone possesses pleochroism—the ability to display different colours when turned at different angles due to selective absorption of light. It is the skill of the gemstone cutter to marry these colours together and form the most pleasing, vivid crimson. The beauty is, as ever, in the details, as subtle movements reveal flashes of orange, pink and purple, a dance referred to as the ‘fire within’, evoking a picture of glowing embers and the rawest of emotions.
This is why gemstones, and rubies in particular, are so fascinating: they resist rigid definition. Their beauty lies in subtle shifts, in the interplay between light and matter, in nuances that cannot be fully captured by simple words. The act of seeing outpaces speaking, and perhaps that mystery is part of what makes the colour in gemstones so powerful.
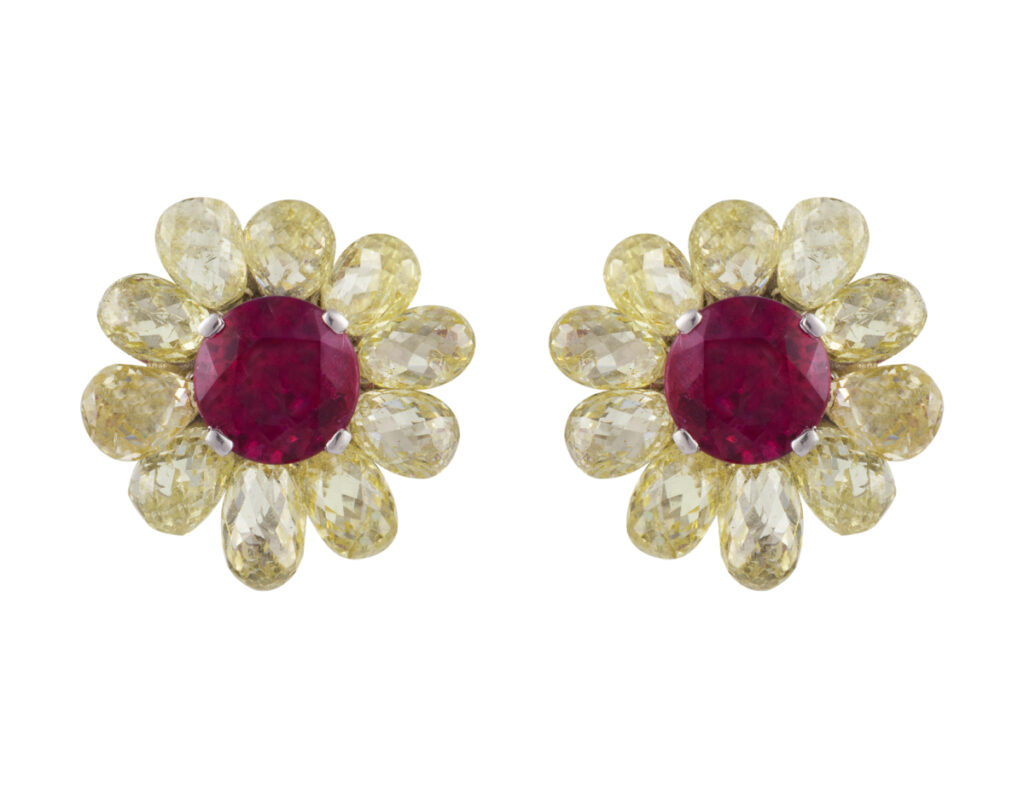
Choosing a Gemfields Mozambican ruby of your very own is easier than you might think. Gemfields collaborates with a number of international jewellery brands, offering an array of jewellery designs to suit your unique style.
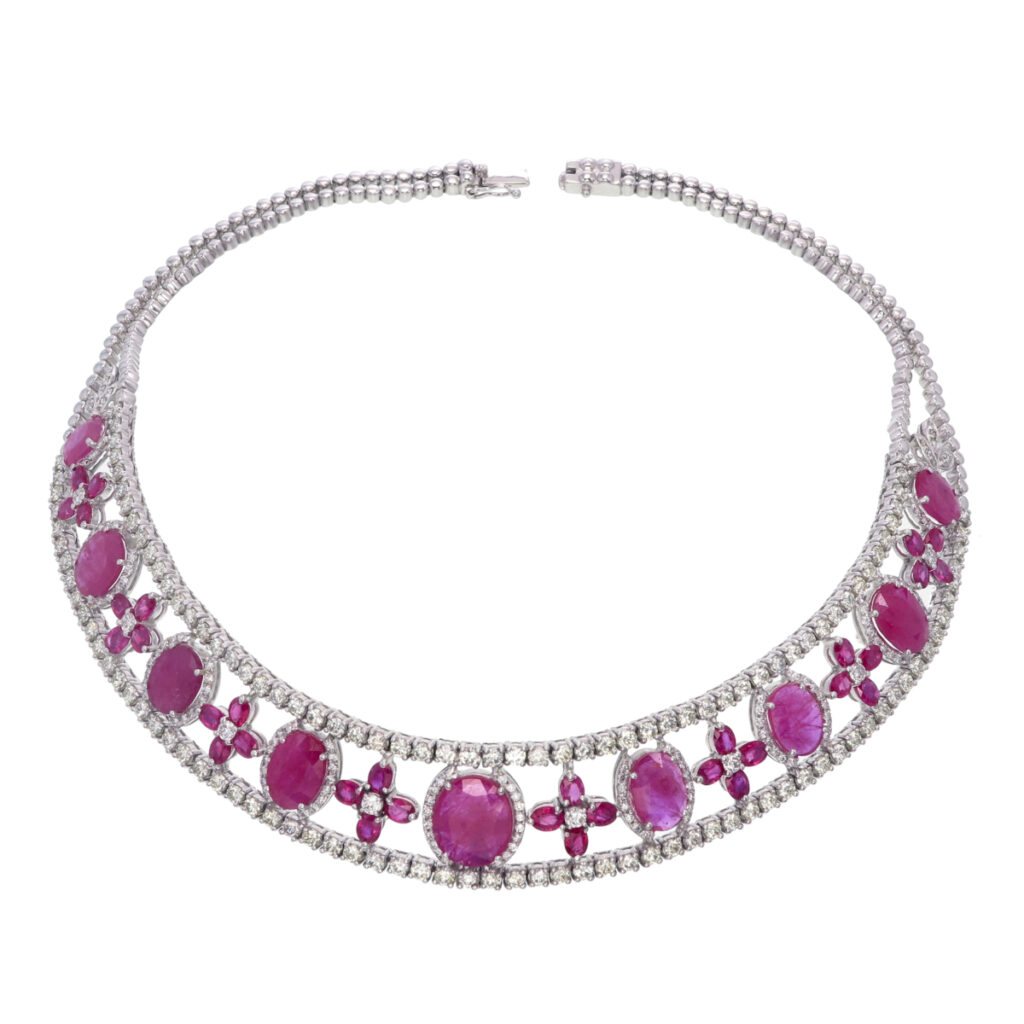
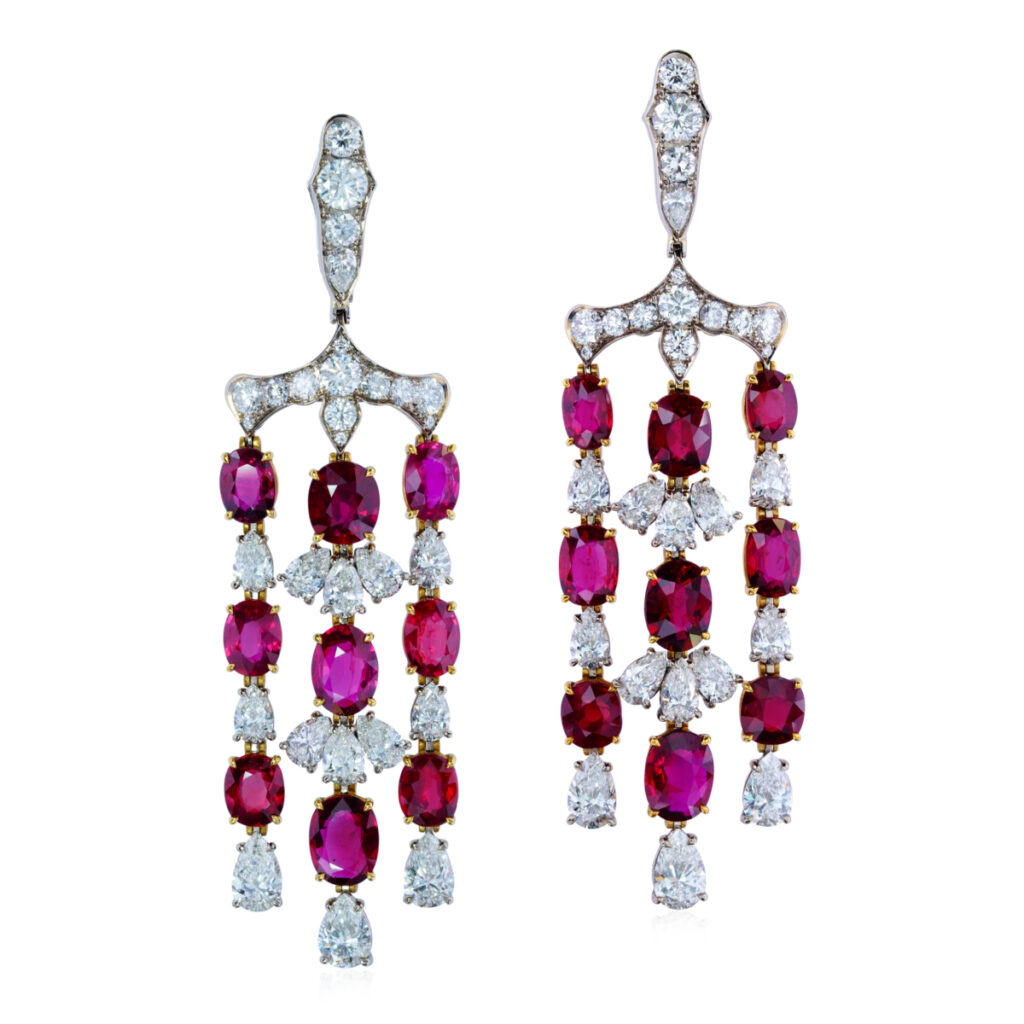
Make a statement with the DIACOLOR x Gemfields Gleaming Flower Earrings, which surround deep red Mozambican rubies with yellow diamond briolettes. Keep your rubies close with the Fehmida Lakhany x Gemfields Ruby and Diamond Choker or The Line x Gemfields Ladhi Ruby Necklace, which pairs rose-cut diamonds with blushing Mozambican rubies. Complete the look with the Ivy New York x Gemfields Chandelier Earrings, featuring over 20 carats of dancing Mozambican rubies.


Gemfields – Ruby: The Fire Within

The Solitaire Festival Of India 2026 Begins This August With Divine Solitaires

The Rise Of Everyday Milestone Gifting:Why Natural Diamond Solitaires Are No Longer Reserved For Weddings

P N Gadgil & Sons Opens New Showroom At Amanora Mall, Hadapsar, Pune

Style, Silver & Scale: How Kushals Is Redefining India’s Fashion Jewellery Landscape
The Rise Of Everyday Milestone Gifting:Why Natural Diamond Solitaires Are No Longer Reserved For Weddings
-
 New Premises10 hours ago
P N Gadgil & Sons Opens New Showroom At Amanora Mall, Hadapsar, Pune
-
 JB Insights7 hours ago
Style, Silver & Scale: How Kushals Is Redefining India’s Fashion Jewellery Landscape
-
 By Invitation7 hours ago
The Rise Of Everyday Milestone Gifting:Why Natural Diamond Solitaires Are No Longer Reserved For Weddings
-
 International News6 hours ago
Gemfields – Ruby: The Fire Within