
International News
Gold plunges by 20% and Silver by 45%. What next?- AUGMONT BULLION REPORT
3,563-carat ‘Star of Pure Land’ features rare six-ray asterism; valuations reportedly reach up to $400 million.
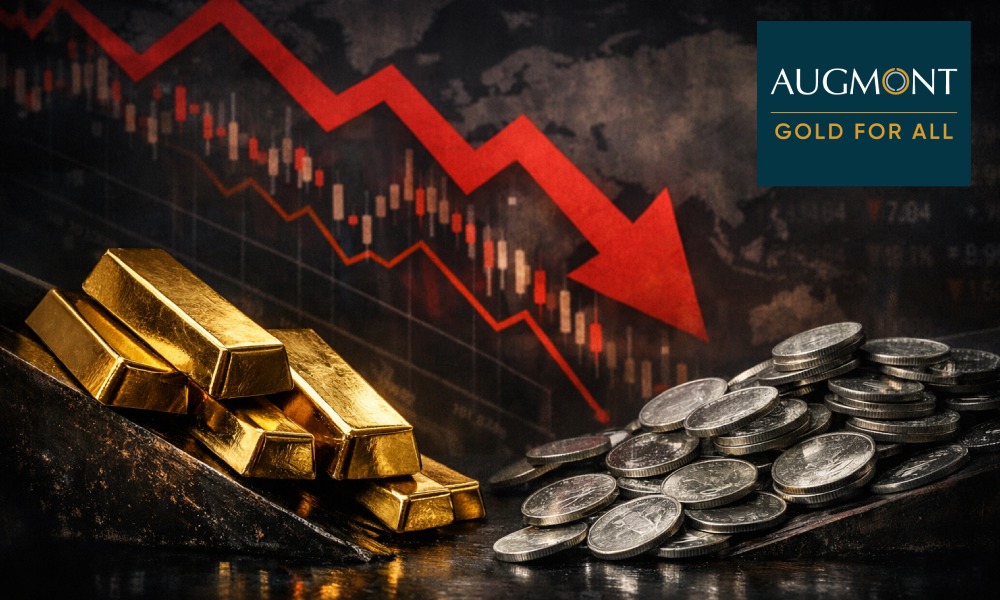
The precious metals market has seen extreme volatility. Gold has plunged nearly 20%, and silver has declined about 45% within just three days, wiping out most of the year-to-date gains. Such a sharp correction is rare and reflects the risks of crowded trades in fast-moving markets.
Over the past year, gold and silver surged to record highs, surprising even experienced market participants. The rally intensified in January as investors sought protection amid geopolitical uncertainty, concerns over currency debasement, and questions around the Federal Reserve’s independence. Strong speculative buying, particularly from China, further amplified the move.
Key factors behind the sharp correction:
- Overcrowded and overbought conditions
Market positioning had become stretched, with record speculative long positions, strong ETF inflows, increased retail participation, and overextended technical indicators. Silver was especially vulnerable due to thinner liquidity and higher leverage. Once prices turned, stop-loss selling and forced liquidation accelerated the decline, with no clear price floor initially visible.
- Nomination of a new Fed Chair
President Trump nominated former Federal Reserve Governor Kevin Warsh to succeed Jerome Powell. While rate cuts remain possible, Warsh is viewed as less dovish than markets had anticipated. His emphasis on inflation control and scepticism toward aggressive quantitative easing supported the US dollar, which weighed on gold prices.
- Disconnect between paper and physical markets.
A significant divergence has emerged between paper prices and physical availability, especially in silver. Several global mints-imposed sales limits or suspensions, the US Mint halted silver product sales, and delivery delays were reported across key markets, including India. Rising lease rates further point to tight physical supply, even as paper prices corrected sharply.
- Margin pressure at exchanges
Major exchanges, led by CME, raised margin requirements on gold and silver futures in response to heightened volatility. Higher margins increased the cost of holding leveraged positions, forcing liquidations. Historically, such margin hikes tend to reset market positioning rather than end long-term bull trends.
Overall, the recent sell-off reflects structural liquidity stress rather than a sudden deterioration in fundamentals. While paper-market prices declined sharply due to forced selling, elevated physical premiums signal ongoing tight supply and highlight the growing divide between financial trading and physical metal ownership.
Looking ahead, market focus will remain on geopolitical developments between the US and Iran, along with key US economic indicators, particularly the ISM Manufacturing PMI and Nonfarm Payrolls.
Historically, periods of strong momentum are often accompanied by sharp but temporary volatility. While recent price action has disrupted short-term technical charts, the long-term trend remains constructive. This suggests the current correction is likely a typical “shake-out” within an ongoing long-term bull market for precious metals.
Gold prices are expected to fall by 3-4% and take support around $4320–4300 (~ Rs 133,000-135,000) zone and stabilise at those levels. These dips should be used as a buying opportunity to accumulate atleast 50% of the investment amount for the long-term. On the upside, any rebound is likely to face immediate resistance near the $4,750–4,800 zone.
The precious metals market has seen extreme volatility. Gold has plunged nearly 20%, and silver has declined about 45% within just three days, wiping out most of the year-to-date gains. Such a sharp correction is rare and reflects the risks of crowded trades in fast-moving markets.
Over the past year, gold and silver surged to record highs, surprising even experienced market participants. The rally intensified in January as investors sought protection amid geopolitical uncertainty, concerns over currency debasement, and questions around the Federal Reserve’s independence. Strong speculative buying, particularly from China, further amplified the move.
Source: AUGMONT BULLION REPORT


International News
Precious Metals Rebound As Fed Rate Fears Ease
Recent Volatility In Technology Stocks Pushed Investors To Seek Shelter In Traditional Safe-Haven Assets
Gold and silver surged on Saturday, June 27, building on recent gains after cooler US inflation data alleviated worries about potential Federal Reserve interest rate hikes. This rebound follows a sharp downturn last week, which had dragged bullion down to its lowest levels since November 2025.
Spot Gold: Advanced 1.6% to settle at $4,089.80 per ounce in New York. Spot Silver: Climbed 2.2% to reach $59.15 per ounce. Other Metals: Platinum and palladium also posted gains.
Beyond the macroeconomic data, broader market anxiety fueled the rally. Recent volatility in technology stocks—largely driven by shifting sentiment around Artificial Intelligence (AI)—pushed investors to seek shelter in traditional safe-haven assets. Despite a 1.7% intraday surge on Friday, gold remains on track for its fourth consecutive weekly decline, marking its longest weekly losing streak since August 2023.
Meanwhile, Indian domestic retail prices held steady on Saturday, maintaining their elevated positions. In Mumbai, prices closely mirrored national trends: 24K Gold: Rs. 1,44,300 per 10 grams.999 Fine Silver: Rs. 2,22,850 per kilogram


Candere Announces Smriti Mandhana As Its New Brand Ambassador

Precious Metals Rebound As Fed Rate Fears Ease

GJEPC Represents Mumbai’s GJ Sector At ODOP Award Assessment

Indriya, Aditya Birla Jewellery, Sets A New Industry Standard With Diamonds Of The Highest Sparkle

Hazoorilal Legacy Debuts ‘Facets’, An Avant-Garde High Jewellery Collection

Ministry Of Good Souls Unveils Its New Bridal Collection In Bespoke 925 Sterling Silver
-
 BrandBuzz3 days ago
Indriya, Aditya Birla Jewellery, Sets A New Industry Standard With Diamonds Of The Highest Sparkle
-
 BrandBuzz3 days ago
Hazoorilal Legacy Debuts ‘Facets’, An Avant-Garde High Jewellery Collection
-
 National News3 days ago
Ministry Of Good Souls Unveils Its New Bridal Collection In Bespoke 925 Sterling Silver
-

 JB Insights1 day ago
The First Gold Story: How Gen Z Is Celebrating Their First Salary