International News
Gold and Silver At Make-Or-Break Levels: Three Forces Driving The Slide AUGMONT BULLION REPORT
Gold Is Testing Its Lowest Levels Of 2026, Hovering Near The Critical Support Zone Of $4,000–$4,060


- Price Movement – Gold and silver are extending their losing streak despite a temporary US-Iran peace deal, pressured by three concurrent forces. First, a broad risk-off wave triggered by a sharp selloff in AI stocks is spilling over into precious metals. Second, increasingly hawkish signals from the Federal Reserve have pushed the probability of a December 2026 rate hike to 86%, lifting the Dollar Index above the 101 mark and weighing on gold. Third, the unwinding of yen carry trades — as USDJPY slides to a 40-year low on rising Japanese interest rates — is generating ripple-effect selling across safe-haven assets.
- Geopolitical Developments– US President Donald Trump stated on Tuesday that Iran had agreed to indefinite nuclear inspections. Tehran promptly disputed this, casting fresh doubt on the deal’s durability and keeping geopolitical uncertainty elevated.
- Macro-Economic Signals – Rate hike expectations are building rapidly. The probability of a July hike has jumped to 36% from just 8.5% a week ago, while September odds have surged from 29.1% to above 70%, per CME FedWatch. Markets now await Thursday’s US PCE data — the Fed’s preferred inflation gauge — for further policy direction.
Technical Triggers
- Gold is testing its lowest levels of 2026, hovering near the critical support zone of $4,000–$4,060 (~Rs. 1,43,000–Rs. 1,44,500). This zone carries a 90% probability of holding and triggering a rebound, given deeply oversold conditions. A breakdown — though unlikely — would open a decline toward $3,600 (~Rs. 1,30,000), a level that would represent a short-lived dip and a strong long opportunity.
- Silver mirrors this setup, consolidating around $60–$61 (~Rs. 2,20,000–Rs. 2,24,000). The same 90% support probability applies. A breach could extend losses toward $54-55 (~Rs. 2,00,000), but any such move is expected to be brief and a buying opportunity.
Support and Resistance
| International Gold Support Level International Gold Resistance Level Domestic Gold Support Level Domestic Gold Resistance Level | : $4000/oz : $4350/oz : Rs. 143,000/10 gm : Rs. 154,000/10 gm |
| International Silver Support Level International Silver Resistance Level Domestic Silver Support Level Domestic Silver Resistance Level | : $60/oz : $71/oz : Rs. 254,000/kg : Rs. 220,000/kg |




International News
Gold Prices On Track To Reach $4,900/oz By End 2026 :Goldman Sachs
Goldman’s $4,900/oz Forecast Assumes Central Bank Demand Averages 50 Tonnes Per Month In 2026 and 40 Tonnes Per Month In 2027
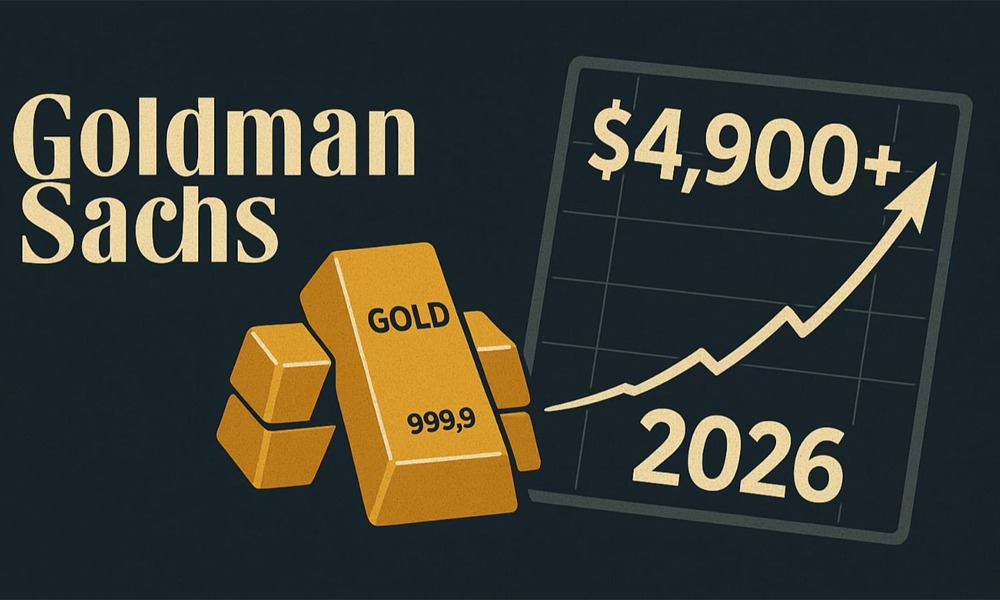
Gold prices are on track to reach $4,900 per ounce by the end of 2026, driven by aggressive central bank purchases—led by undisclosed buying from China—and recovering exchange-traded fund (ETF) demand, Goldman Sachs said in a research note.
The bank maintained its bullish base-case target for bullion while warning that positioning in options markets could amplify price volatility in both directions. Central banks accumulated an estimated 44 tonnes of gold in July, well above the pre-2022 monthly average of 17 tonnes, according to Goldman Sachs’ nowcast model. On a three-month seasonally adjusted basis, central bank buying stood at 91 tonnes per month.
China was the primary driver, with Goldman estimating the People’s Bank of China bought 35 tonnes in July—roughly 75% more than official public disclosures indicated.
To account for unreported sovereign purchases, Goldman’s model tracks physical bullion flows through London’s over-the-counter (OTC) market into custodian vaults. The Bank of England’s central bank holdings alone rose by 63 tonnes in July, exceeding outflows from the Federal Reserve Bank of New York.
Price Risks and Volatility
Goldman’s $4,900/oz forecast assumes central bank demand averages 50 tonnes per month in 2026 and 40 tonnes per month in 2027, alongside steady Federal Reserve policy and a rebound in private ETF inflows.
However, analysts noted that elevated demand for gold call options—used by investors to hedge against macroeconomic and geopolitical risks—creates mechanical upside and downside risks:
Bullish Case: Continued strong ETF inflows combined with existing call option positioning could force options dealers to buy underlying metal to hedge short exposure, pushing prices “well above” $4,900.
Bearish Case: If the Federal Reserve resumes interest rate hikes, unwinding hedge positions and triggering ETF outflows, gold could drop to $4,440/oz by end-2026. Goldman noted that ongoing central bank buying would limit further downside.
Goldman expects the Federal Reserve to remain on hold through 2026 as inflation cools, removing a key interest rate headwind for the non-yielding asset.


-

 Special Reports1 day ago
Growth of the 925 Sterling Silver Gifting Segment
-

 ShowBuzz1 day ago
TRENDS @ SSI DELHI 3RD EDITION
-

 JB Insights2 days ago
Devotion, Heritage & Diversification: The defining trends of SSI Delhi’s 3rd Edition
-

 JB Insights2 days ago
Gold-plated silver jewellery is seeing explosive growth