
International News
Gemfields Reports Updated G-Factor Metrics, Highlights Government Revenue Contributions
10-year Data Underscores Fiscal Impact From Kagem and Montepuez Operations Amid Evolving Market Conditions

Gemfields has released its latest G-Factor for Natural Resources figures, offering an updated view of how its mining operations contribute to host government revenues. The data, announced on April 9, 2026 in London, covers the period up to December 31, 2025.
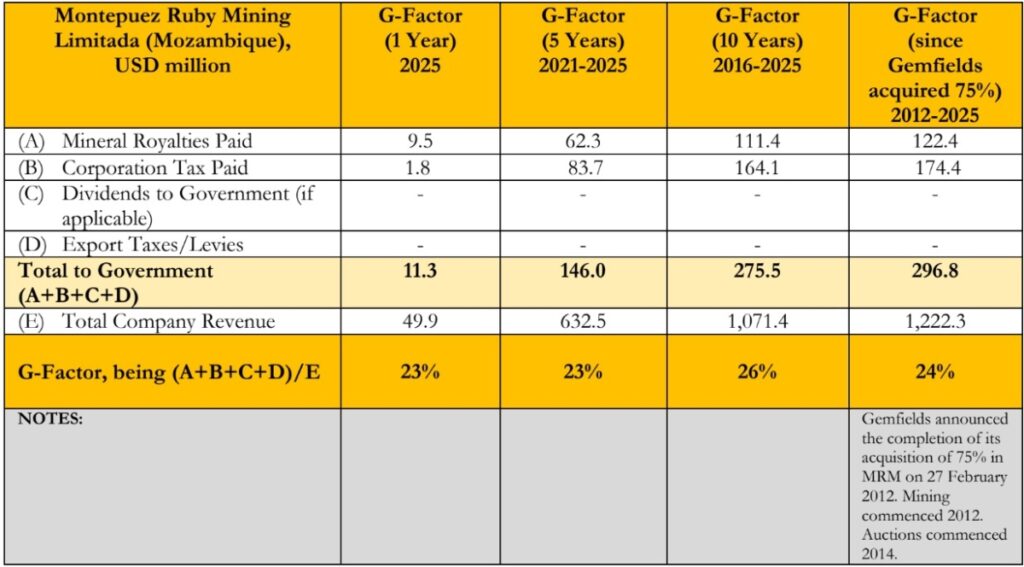
Over the 2016–2025 period, the company reported a G-Factor of 17% for its Kagem emerald mine in Zambia and 26% for Montepuez Ruby Mining in Mozambique. The G-Factor measures the share of revenue paid to governments through channels such as royalties, taxes, dividends, and other levies, offering a transparent benchmark of economic contribution.
Looking specifically at 2025, Montepuez Ruby Mining recorded a G-Factor of 23%, contributing $11.3 million to the Government of Mozambique on revenues of $49.9 million. Meanwhile, Kagem posted a lower 6% G-Factor, with $4.9 million paid to the Zambian government against revenues of $84.1 million.
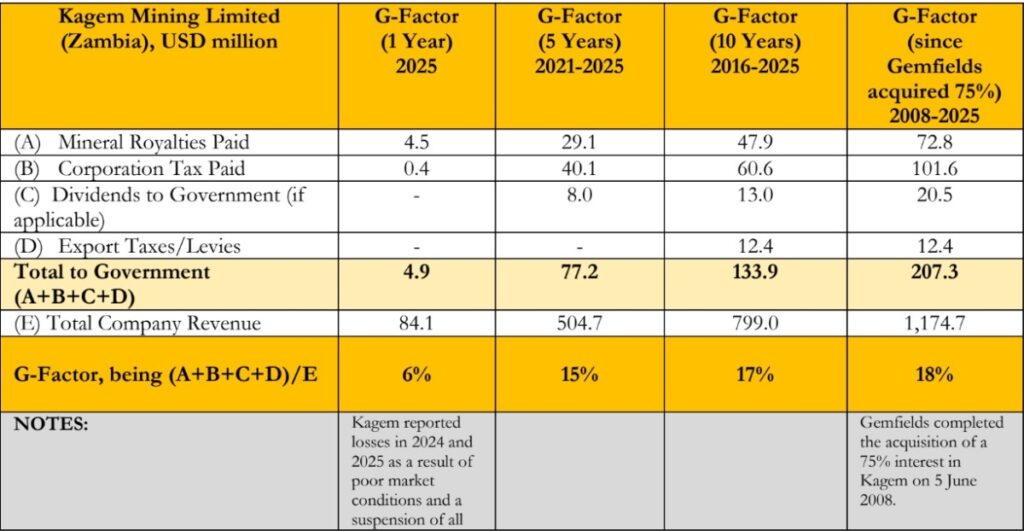
The dip at Kagem was linked to operational disruptions, including a temporary suspension of mining between January and April 2025, as well as the impact of a 15% export tax on precious gemstones, which was later lifted in March 2025.
CEO Sean Gilbertson noted that the figures reflect varying operating and market conditions. While Montepuez saw lower premium ruby output, alongside a delayed auction and challenges such as illegal mining, its overall contribution ratio remained relatively stable.
Introduced in 2021, the G-Factor serves as a transparency tool for the natural resources sector, helping stakeholders assess how effectively resource extraction translates into public revenue.
Gemfields expects Kagem’s performance to move back toward its long-term average of around 18% as operations normalise and market dynamics improve. The company continues to advocate for wider industry adoption of the metric to enhance accountability and comparability across the sector.
The G-Factor for Natural Resources is expressed as a percentage and is calculated as:
Ap + Bp + Cp + Dp
—————————————
Ep
where:
· A = the total mineral royalty (tax on revenue) paid by the reporting company to the host
country government during the period
· B = the total corporation tax (tax on profit) paid by the reporting company to the host
country government during the period
· C = the dividends paid by the reporting company to the host country government during
the period (where the host country government is a shareholder in the reporting company)
· D = the total export taxes or export levies paid by the reporting company to the host
country government during the period
· E = the total revenues of the reporting company during the period
· p = the relevant period, typically calculated for each of (i) the prior year; (ii) the preceding
5 years and (iii) the preceding 10 years
· The sums actually paid during the period (rather than the sums accrued or falling due during
the period) are used for A, B, C, and D.

International News
Dolce & Gabbana Unveils Alta Gioielleria Taormina Collection Inspired By Sicily’s Timeless Heritage
The Latest High Jewellery Collection Celebrates Sicily’s Vibrant Landscapes, Sacred Traditions, and Exceptional Craftsmanship Through Handcrafted Masterpieces Adorned With Intricate Goldwork and Precious Gemstones.
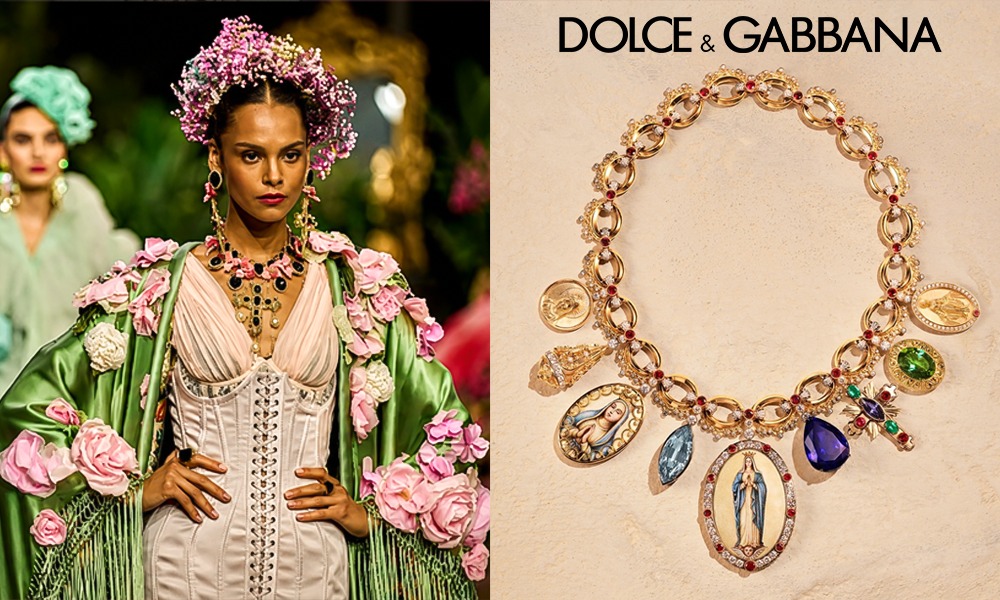
Dolce & Gabbana has unveiled its Alta Gioielleria Taormina Collection, a spectacular tribute to Sicily’s rich heritage, drawing inspiration from the island’s vibrant landscapes, sacred traditions, and artistic legacy.
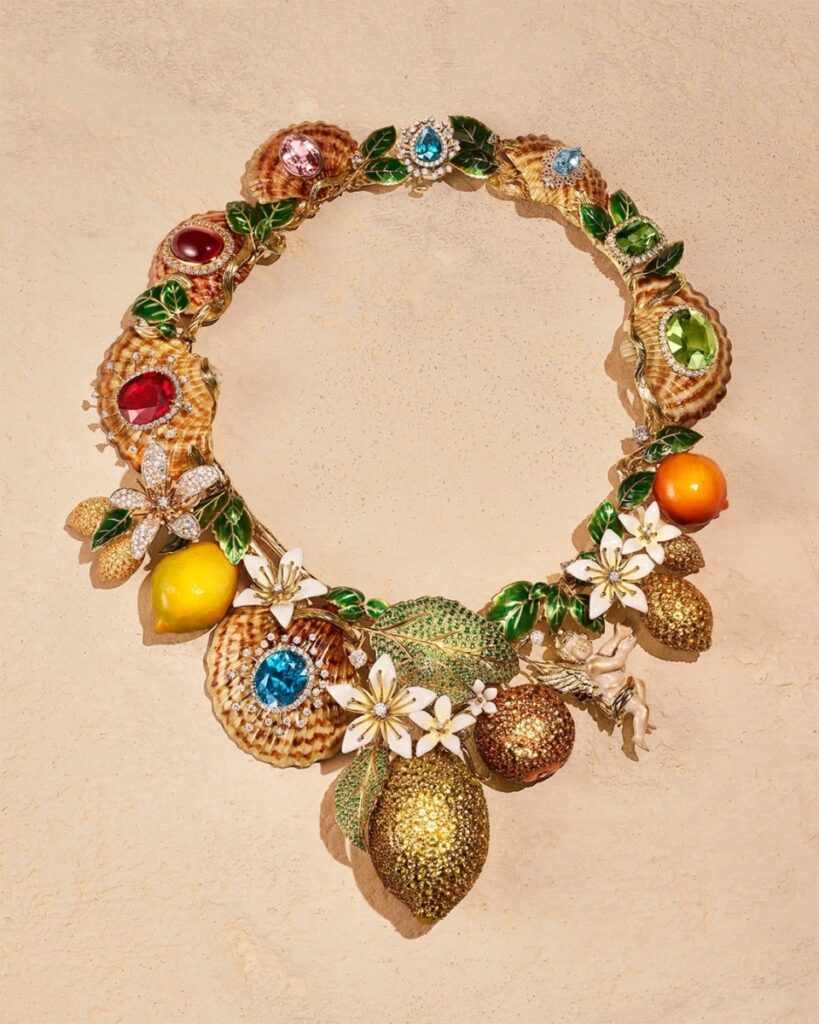
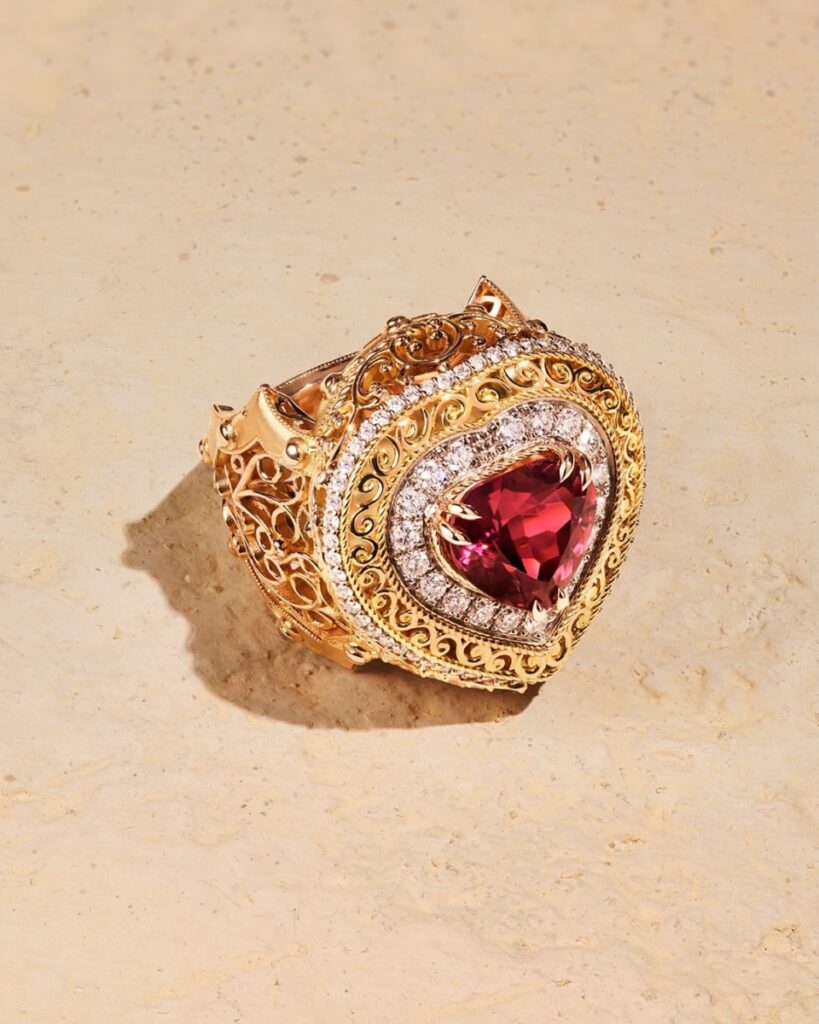
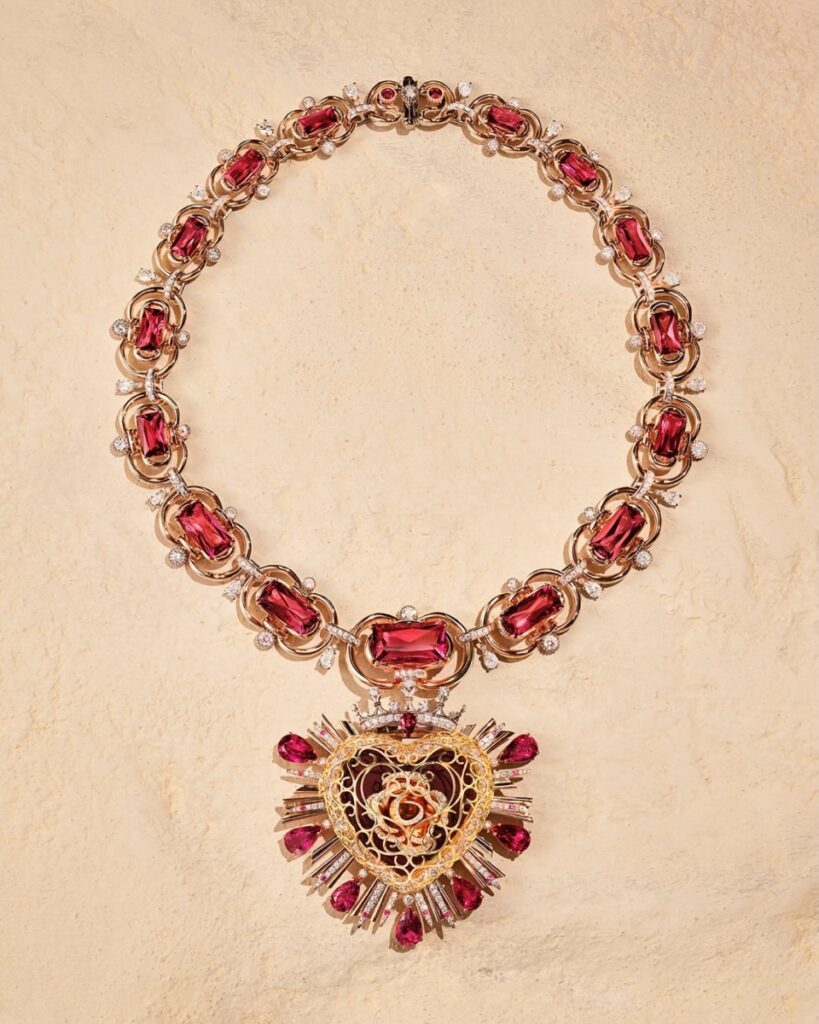
Each masterpiece in the collection is meticulously handcrafted, showcasing intricate goldwork, hand-painted details, and precious gemstones that reflect the beauty and cultural richness of Sicily. The designs embody the Maison’s commitment to Italian craftsmanship, combining traditional artistry with contemporary luxury.
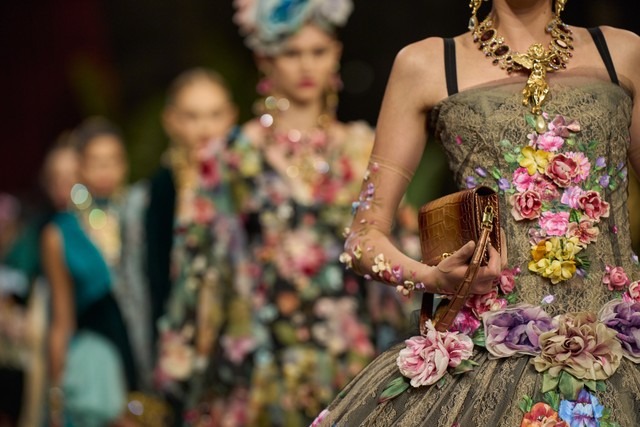
More than a high jewellery collection, the Alta Gioielleria Taormina Collection celebrates Italian culture, timeless elegance, and the enduring spirit of luxury craftsmanship, reinforcing Dolce&Gabbana’s legacy of creating extraordinary jewellery inspired by art, history, and heritage.
Collection Highlight:
- San Domenico Setting: Displayed within the ancient cloisters and halls of San Domenico.
- Artisan Roses: Features hand-sculpted and enamelled gold roses enclosed in unique settings.
- Sacred Motifs: Includes parures that pay direct tribute to the artistic veneration of the Madonna.
- Couture Context: Debuted alongside the Alta Moda presentation at Radicepura and the Alta Sartoria show at the ancient Teatro Antico.


Tanishq Marks 30 Years With ‘Celebrating You’ Campaign Featuring Real Customers Across India

Dolce & Gabbana Unveils Alta Gioielleria Taormina Collection Inspired By Sicily’s Timeless Heritage

Harit Zaveri Jewellers Presents Its Signature Heritage Collection – Saanjh, Bringing Together Timeless Craftsmanship, Uncompromising Quality and Exceptional Value

Akoirah by Augmont Celebrates The Family We Choose With A Thoughtfully Curated Friendship Day Gifting Edit
Harit Zaveri Jewellers Presents Its Signature Heritage Collection – Saanjh, Bringing Together Timeless Craftsmanship, Uncompromising Quality and Exceptional Value
Dolce & Gabbana Unveils Alta Gioielleria Taormina Collection Inspired By Sicily’s Timeless Heritage
-
 National News14 hours ago
Akoirah by Augmont Celebrates The Family We Choose With A Thoughtfully Curated Friendship Day Gifting Edit
-
 National News13 hours ago
Harit Zaveri Jewellers Presents Its Signature Heritage Collection – Saanjh, Bringing Together Timeless Craftsmanship, Uncompromising Quality and Exceptional Value
-
 International News11 hours ago
Dolce & Gabbana Unveils Alta Gioielleria Taormina Collection Inspired By Sicily’s Timeless Heritage
-
 BrandBuzz10 hours ago
Tanishq Marks 30 Years With ‘Celebrating You’ Campaign Featuring Real Customers Across India