International News
Focus shifts back to tariff war and geopolitics: AUGMONT BULLION REPORT


Gold saw a strong increase last week, jumping about 4% as the dollar fell following U.S. President Donald Trump’s warning to put 50% tariffs on European Union imports on July 9. This further shook the global economy and increased demand for safe-haven assets. Trump says he would impose 25% tariffs on Samsung and Apple devices.
The dollar saw its largest weekly percentage drop since early April last week, falling 2% and returning to 99 levels. The main issue affecting the dollar at the moment is the decline in trust in American policy. The Congressional Budget Office estimates the recently enacted US tax measure, which is now headed to the Senate, will cost close to $4 trillion, escalating concerns about long-term fiscal instability. These worries about growing deficits and growing debt servicing costs are highlighted by Moody’s recent lowering of the US credit rating.
The spending package is anticipated to be discussed by the US Senate and put to a vote before July 4 following the Memorial Day vacation on May 26. Markets may find it challenging to stage a consistent recovery if they continue to believe that the Senate will adopt the package with few modifications.
Since Moody’s lowered the US credit rating late last Friday, raising worries about the nation’s $36 trillion debt burden and Trump’s quest for tax cuts that may increase it by $4 trillion, investor sentiment has been brittle.
Meanwhile, Gold received a further lift from rising international tensions. Risk aversion was exploited by the precious metal due to the lack of progress in Ukraine-Russia talks and growing concerns of a worsening Middle East conflict following reports of Israel increasing its strikes on Gaza and preparing to target nuclear facilities in Iran.
Headlines of the US trade talks will be closely examined in the interim. Safe-haven flows may continue to control financial market activity and pave the way for another move higher in gold prices if the US is unable to advance negotiations with important trading partners like the EU and Japan. Furthermore, the precious metal may continue to benefit from a further escalation of Middle East hostilities.
Gold prices are expected to trade in the range of $3275 (~Rs 95000) and $3375(~Rs 96400) in the near term. Either side breakout or breakdown will give 2-3% movement. Silver is expected to continue its range-bound momentum from $32 (~Rs 94000) to $34(~Rs 98000) going forward.
| Metal | Expected Price Range (USD) | Approx. INR Equivalent | Notes |
|---|---|---|---|
| Gold | $3,275 – $3,375 | ₹95,000 – ₹96,400 | Breakout or breakdown may lead to a 2–3% move in either direction |
| Silver | $32 – $34 | ₹94,000 – ₹98,000 | Expected to remain range-bound in this zone for the near term |








International News
US Jewellery Companies Continued To Shrink In The Third Quarter:JBT
During Q3, Business Closures Dropped To 116 Compared To 126 In The Prior Year’s Third Quarter, Driven By 88 General Operational Cessations, 28 Acquisitions Or Mergers, and Zero Bankruptcies.

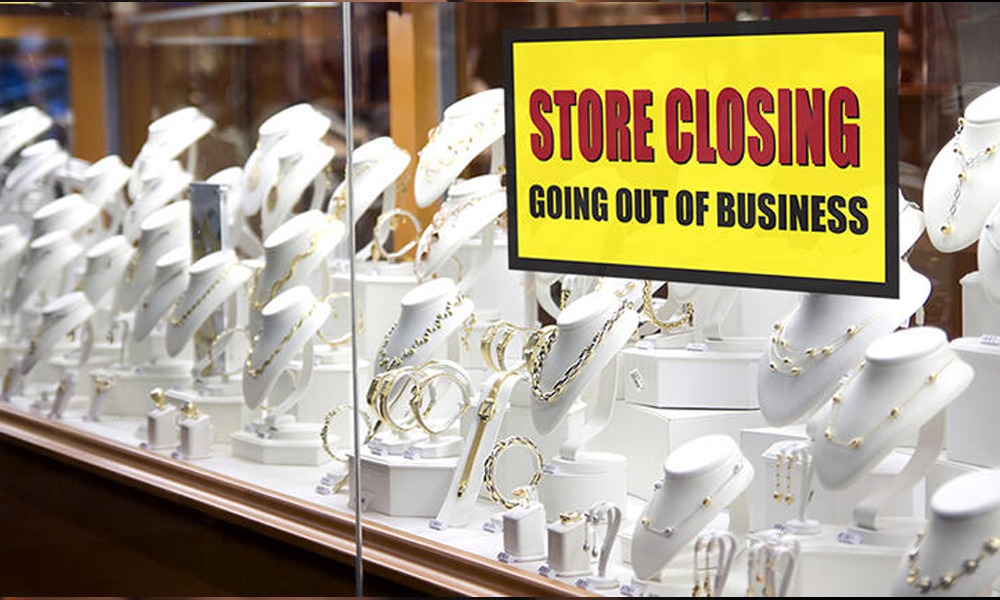
The number of active US jewelry companies continued to shrink in the third quarter, but at a slower pace than a year ago, according to the latest data from the Jewelers Board of Trade (JBT).The US jewelry industry continued its structural consolidation through Q3, though the pace of business closures showed signs of stabilizing compared to the previous year. Data from the Jewelers Board of Trade (JBT) reflects ongoing consolidation across retail, wholesale, and manufacturing, coupled with heightened credit volatility.
Key Data & Metrics
Nationwide, the active business footprint stands at 21,831 companies, reflecting a 1.4% year-over-year decline. During Q3, business closures dropped to 116 compared to 126 in the prior year’s third quarter, driven by 88 general operational cessations, 28 acquisitions or mergers, and zero bankruptcies. Meanwhile, new market entrants also slowed, with 67 new business openings recorded in Q3 down from 89 during the same period last year.
Sector-by-Sector Breakdown
| Sector | Active Count | YoY Change | Impact Summary |
| Retailers | 16,564 | -1.5% | Makes up the majority of the sector; experienced the largest net store count reduction. |
| Manufacturers | 2,061 | -1.7% | Steepest percentage decline among all segments. |
| Wholesalers | 3,206 | -0.9% | Relatively stable, holding the mildest contraction rate. |
Credit & Financial Health Trends
The JBT report highlights dynamic shifts in creditworthiness across US and Canadian businesses, signaling bifurcated financial health:
- Credit Downgrades: Jumped sharply to 1,655 (up from 620 in Q3 of the prior year).
- Credit Upgrades: Rose significantly to 1,480 (up from 551 in Q3 of the prior year).
While net business closures are tapering off, high numbers of simultaneous upgrades and downgrades point to a split market where resilient operators are strengthening their positions while vulnerable businesses face tighter financial pressures.



Gold Is Back On The Moodboard: Palmonas’ 9KT Jewellery Picks For Festive Gifting

US Jewellery Companies Continued To Shrink In The Third Quarter:JBT

US Demand Slowdown Hits Diamond, Apparel, Exporters As Factories Shut and Orders Dry Up

Dhanteras Shopping Guide 2026:Gold, Silver, Diamonds & Festive Jewellery Trends To Watch

From Diya Puja To Diwali Soirées: Jewellery Designed To Go Beyond The Festive Season

The Solenne Collection: A Celebration Of Diwali By Bharti Bangur Fine Jewels
-
 JB Insights1 week ago
Dhanteras Shopping Guide 2026:Gold, Silver, Diamonds & Festive Jewellery Trends To Watch
-
 BrandBuzz1 week ago
From Diya Puja To Diwali Soirées: Jewellery Designed To Go Beyond The Festive Season
-
 BrandBuzz1 week ago
The Solenne Collection: A Celebration Of Diwali By Bharti Bangur Fine Jewels
-

 National News1 week ago
Indriya, Aditya Birla Jewellery Unveiled India’s Largest Sustainable Jewellery Rangavalli