International News
WGC Gold ETF Commentary: Global flows stay hot

March and Q1 in review
Global physically backed gold ETFs1 reported strong inflows in March totalling US$8.6bn (Table 1, p2).2 This helped drive total Q1 flows of US$21bn (226t) to the second highest quarterly level in dollar terms, only behind Q2 2020’s US$24bn (433t).
North America (61%) and Europe (22%) represented the bulk (83%) of net inflows in Q1. Asia contributed 16% – impressive given that the region’s total assets under management (AUM) only account for 7% of the global total. Additionally, first quarter flows in Europe of US$4.6bn stood out as the strongest quarter since Q1 2020. As a result, and aided by gold’s price increase, AUM reached another all-time-high of US$345bn, representing an increase of 13% in March and 28% through the first quarter.
Additionally, collective holdings rose to 3,445t by the end of March, a 92t addition in the month and 226t higher through Q1, reaching the highest month end level since May 2023 and 470t shy of the record of 3,915t in October 2020.
Highlights
Global gold ETF inflows continued in March, with positive demand witnessed across all regions.
After four monthly inflows in a row, total AUM of global gold ETFs reached another month-end peak of US$345bn and holdings rose 3% to 3,445t.
Global gold markets saw a mild decline in volumes during March amid cooling OTC activities.
Regional overview
North American demand led global flows, adding US$6.5bn and constituting 76% of total flows this month, and US$12.9bn during the quarter. This move higher can be attributed to familiar drivers:
• the strong price momentum sent gold to above the US$3,000/oz threshold
• yields remained rangebound
• the dollar slipped to levels not seen since last November • tariff and war uncertainty provided continued support.
Additionally, equity pullbacks, due to growth concerns and market liquidity worries amid ongoing quantitative tightening, further pushed up investor demand for safe haven assets.Also, increased option activity helped drive US$2.1bn (22 tonnes) inflows at monthly expiry.
As a result, North American funds posted another strong monthly performance, and the region solidified its significant contribution to global quarterly flows.
Europe saw sizable inflows, drawing US$1bn in March and US$4.6bn during Q1. The rally this month stemmed primarily from the UK, Switzerland and Germany. Although the Bank of England made no changes to its benchmark rate during its March meeting, a cloudy growth outlook further weighed by US tariff concerns, weak stock market performance and the gold price surge, drove demand higher in the UK. Equally, despite a jump in the 10-year German Bund yield in early March amid Germany’s massive spending plan, investors in Europe continue to add gold ETFs to their portfolios as the ECB’s March cut encouraged further easing expectations6 and US tariff risks loom over the growth outlook.
Inflows were sustained for the fourth consecutive month in Asia, attracting nearly US$1bn in March and US$3.3bn through the first quarter. China and Japan dominated demand in March, both likely driven by rocketing gold price performances, which dwarfed other assets in the month, and roaring global trade policy risks. Additionally, inflationary worries may have helped drive gold ETF inflows in Japan. India saw mild outflows, ending its 11-month inflow streak as investors may have booked profit. Funds in other regions saw another month of positive demand, albeit only modestly at US$98mn, as Australia and South Africa continue to register gold ETF inflows.
Gold trading volumes pullback
Trading activity across global gold markets in March came in at US$266bn/day – broadly in-line with the quarterly average of US$270bn/day. LBMA OTC trading of US$136bn/day, resulted in a quarterly average of US$140bn/day. This marks a notable increase when compared to the 2024 daily average of US$113bn.
Exchange volumes continued to rise in March, with COMEX taking the charge amid the strong gold price performance. Increased option activity supported North American ETF volumes, but global gold ETF activities still fell mildly m/m.
Total net longs of COMEX’s gold futures fell 3% to 804t by the end of March. Net long positions held by money managers remained relatively stable at 599t, down slightly from 605t at the end of February. While money manager net longs declined during the first half of March—likely due to profit-taking—renewed interest driven by US trade policy and geopolitical uncertainties led to increased exposure later in the month. Notably, this rebound followed five consecutive weeks of de-grossing that began in February, bringing net longs just above year-end levels of 764 tonnes.

International News
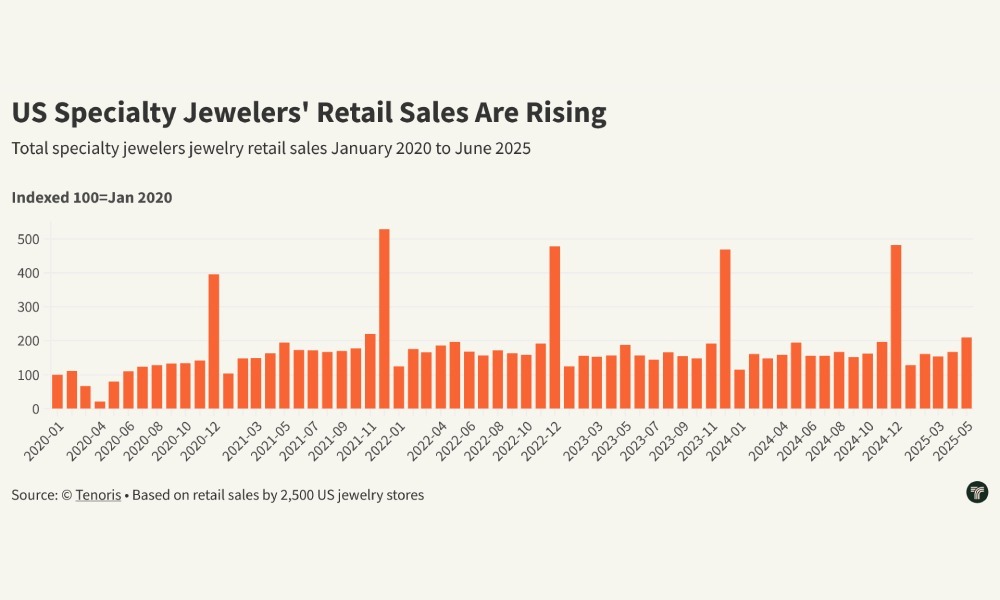
Tenoris Report: 5% rise in jewellery sales in H1 2025
Gold jewellery led category growth with low double-digit revenue gains

The jewellery market posted a healthy 5% revenue growth in H1 2025, according to Tenoris, sustained by a steady five-month rise and a 3% increase in June sales. While the total number of pieces sold declined, consumers spent more per item, leading to a 10% surge in expenditure per unit in June and higher average prices across diamond, sapphire, gold, platinum, and silver jewellery.
Lab-grown jewels stood out, recording higher unit sales despite falling average prices, reflecting shifting consumer preferences. Round diamonds, though still dominant at 52% of sales, are gradually losing ground to oval shapes, which now account for 20%.
Finished jewellery also performed well, especially bracelets, which saw nearly 10% year-on-year revenue growth. Demand is strengthening in higher price segments, notably items priced between $7,500 and $10,000.
Natural diamond jewellery sales dipped in June but rose 3% year-to-date, driven by demand for pendants, bracelets, and necklaces above $2,500, often featuring lab-grown diamonds. The loose natural diamond market saw higher average carat weights but longer inventory turnover, while lab-grown loose diamonds continued to capture market share. Overall, the industry is rebounding from flat sales in H1 2024 and is focused on tapping new consumer demographics to sustain momentum.
International News
Gold edges lower on rebounding Dollar as trade war intensifies AUGMONT BULLION REPORT
As the trade war heats up, the dollar trades at a two-week high against the yen, while gold drops below $3300.

- A 50% tariff on copper imports, possible 200% duties on pharmaceuticals, and a 10% levy on goods from BRICS nations are just a few of the extensive new measures that President Donald Trump announced, ruling out future extensions to the August 1 tariffs.
- Meanwhile, following a strong US jobs report last week, which allayed concerns about a slowing economy, the Fed lowered its July rate drop predictions.
- The expectation for more rate cuts has also decreased because the tariffs are anticipated to increase US inflation in the upcoming months.
- Investors are now waiting for the minutes of the June FOMC meeting to be released in order to gain further understanding of the Fed’s policy position.
Technical Triggers
- Gold continues to trade near the lower side of the range of $3300 (~Rs 96250) and $3400 (~Rs 98500). If prices sustain below $3280 (~Rs 96000), weakness could further extend to $3200 (~Rs 94000).
- Silver is not able to sustain above its range of $37.5 (~ Rs 108,500) and $35.5 (~ Rs 105,000). Consolidation continues before heading higher towards the next target is $38 (~Rs 110,000)
Support and Resistance
For Gold
| Region | Support Level | Resistance Level |
|---|---|---|
| International Gold | $3280/oz | $3370/oz |
| Indian Gold | ₹96,000/10 gm | ₹97,700/10 gm |
For Silver
| Region | Support Level | Resistance Level |
|---|---|---|
| International Silver | $35.5/oz | $37.5/oz |
| Indian Silver | ₹1,05,000/kg | ₹1,10,000/kg |
International News
WGC REPORT :Gold ETF Flows- June 2025
Global gold ETFs’ total AUM rose to a month-end peak and holdings bounced to the highest in 34 months

H1 in review
Global physically backed gold ETFs1 saw inflows of US$38bn during H1, boosted by strong positive flows in June (Chart 1), marking the strongest semi-annual performance since H1 2020.2 All regions saw inflows last month, with North American and European investors leading the charge.
During the first half, North America accounted for the bulk of inflows, recording the strongest H1 in five years. And despite slowing momentum in May and June, Asian investors bought a record amount of gold ETFs during H1, contributing an impressive 28% to net global flows with only 9% of the world’s total assets under management (AUM). European flows finally turned positive in H1 2025 following non-stop semi-annual losses since H2 2022.
By the end of H1 the surging gold price and notable inflows pushed global gold ETFs’ total AUM 41% higher to US$383bn, a month-end record. Collective holdings in H1 grew 397t to 3,616t, the highest month-end value since August 2022 (Chart 2).
Regional overview
North America attracted US$4.8bn in June – the strongest monthly inflow since March – bringing total H1 inflows to US$21bn. Spiking geopolitical risks amid the Israel-Iran conflict boosted investor demand for safe-haven assets and supported inflows into North American gold ETFs. Although it held rates steady in June, the US Fed continued to express concerns about slowing growth and rising inflation.3 Markets are now pricing in three rate cuts by the end of 2025 and an additional two in 2026.
The investor response has been swift: US Treasury yields declined, and the dollar continued to weaken. Persistent policy uncertainty and ongoing fiscal concerns are likely to remain an overhang on the market, which in turn could help support gold ETF demand in the near to medium term.
European inflows continued for a second month, adding US$2bn in June – the strongest since January – and lifting the region’s H1 total to US$6bn. The UK led inflows in the month; although the Bank of England kept rates unchanged at its June meeting, the stance was generally dovish. 4 Combined with weaker growth, easing inflation and the cooling labour market, investors raised their bets on future rate cuts. This resulted in local yields declining and pushed up gold’s allure. Meanwhile, the eighth cut from the European Central Bank, uncertainties surrounding growth, and rising geopolitical risks generally, contributed to gold ETF demand in several major markets.
Asian flows flipped positive in June, albeit only mildly at US$610mn, ending at US$11bn – a record amount for any H1 period. India led inflows in June, likely supported by rising geopolitical risks in the Middle East. Japan recorded inflows for the ninth consecutive month (US$198mn, US$1bn H1), possibly driven by elevated inflationary concerns – particularly when the rice price surged.6 China only saw mild inflows in the month (US$137mn) as trade tensions eased and the local gold price moderated.7 Nonetheless, China’s H1 inflows of US$8.8bn (85t) were unprecedented amid spiking trade risks with the US, growth concerns and the surging gold price.
-

 National News5 days ago
Malabar Gold & Diamonds Inaugurates Landmark Integrated Manufacturing Site in Hyderabad, Cementing Its Position as a Global Manufacturing Leader
-

 National News2 months ago
Emmadi Silver Jewellery Launches First Karnataka Store with Grand Opening in Bengaluru’s Malleshwaram
-

 BrandBuzz3 months ago
Mia by Tanishq Unveils ‘Fiora’ Collection This Akshaya Tritiya: A Celebration of Nature’s Blossoms and New Beginnings
-

 GlamBuzz2 months ago
Gokulam Signature Jewels Debuts in Hyderabad with Glamorous Launch at KPHB


