
International News
Treasury yield declines on heightened rate cut expectations AUGMONT BULLION REPORT
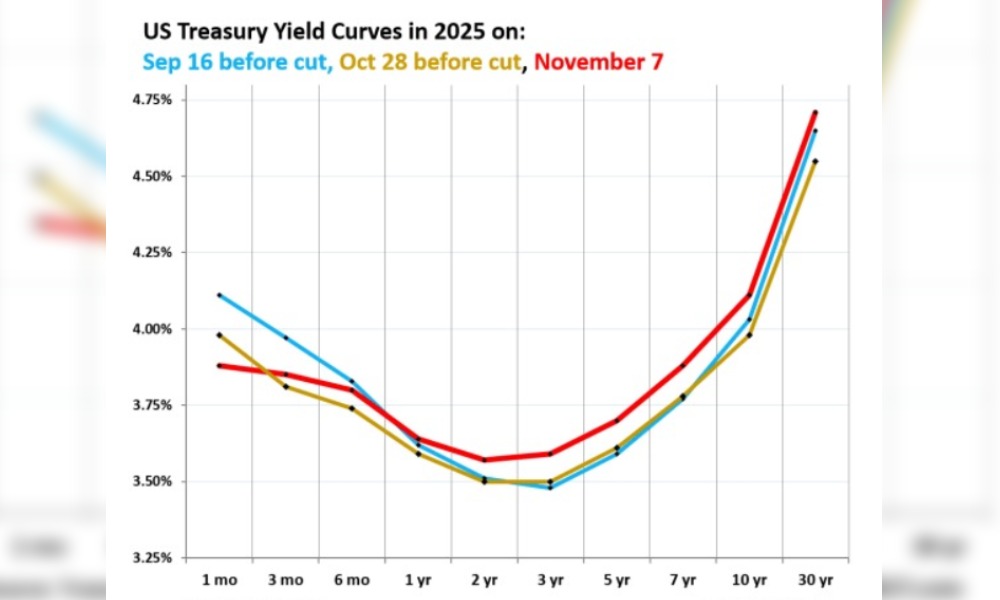
- 10-year US Treasury yields have decreased 3.5% during the past four days, coming back to 4.00% level, amid heightened rate cut expectations. US macro data revealed indications of declining inflation and increased the Federal Reserve’s leeway to further lower interest rates. Consequently, this situation helps the precious metals to trade higher and push the US dollar to a one-week low.
- The likelihood that the Fed would lower interest rates by 25 basis points to 3.50%–3.75% at the December meeting has risen to 85.3% from 50.1% a week ago, according to the CME FedWatch tool.
- Furthermore, a persistent increase in the price of the precious metal is limited by expectations of a peace agreement between Russia and Ukraine. However, given that investors are now looking to more US data for some encouragement, the fundamental background indicates that the path of least resistance for gold is to the upward.
US Technical Triggers
- Gold has been trading in the range of $4000 (~Rs 121,000) and $4200 (~Rs 127,000). Buy on dips around support and sell on rallies around resistance.
- Silver has been trading in the range of $49 (~Rs 150,000) to $53 (~Rs 160,000). Buy on dips around support and sell on rallies around resistance.
Support and Resistance
| Commodity | Support Level | Resistance Level |
|---|---|---|
| International Gold | $4000/oz | $4200/oz |
| Indian Gold | ₹121,000 / 10 gm | ₹127,000 / 10 gm |
| International Silver | $49/oz | $53/oz |
| Indian Silver | ₹150,000 / kg | ₹160,000 / kg |


International News
Precious Metals Bounce Back As Iran Ceasefire Hopes Rise, But Fed Rate Fears Loom: AUGMONT BULLION REPORT
Gold Remains Under Short-term Pressure from Expectations of Fed Tightening and a Strong Dollar. However, Investor Positioning in Gold Looks Relatively Light After Months of ETF Outflows.

Price Movement – Gold has bounced back from its key support levels near $3960, and Silver has recovered from $55, after an Iranian official reportedly received a proposal for a 10-day ceasefire. The continuing US-Iran standoff has kept investors worried about energy-driven inflation and the possibility of further rate hikes. Markets are now pricing in an 83% chance of a US rate hike in December, up sharply from 73% just a week earlier, based on the CME FedWatch tool.
Geopolitical Tensions – Despite the Houthis announcing fresh military action, both Tehran and Washington appear keen to restart talks and stop the escalating attacks that have nearly destroyed a fragile interim agreement reached last month. A senior Iranian official told Reuters on Monday that mediators had proposed a 10-day ceasefire, aimed at rescuing the interim deal and eventually leading to a lasting peace agreement.
Macro-Economic Signals – Gold remains under short-term pressure from expectations of Fed tightening and a strong dollar. However, investor positioning in gold looks relatively light after months of ETF outflows, meaning further price drops may be limited. Strong physical demand, especially from China, along with continued central bank buying, is providing solid support to the gold market.
Technical Triggers
If Gold fails to hold above $4,000 (~Rs.1,41,000), it could slide further to $3,900 (~Rs.1,38,000). But if it manages to stay above $4,200, a fresh rally could take it toward $4,500 (~Rs.1,55,000).
For Silver, a strong move above $63 (~Rs.2,35,000) could push prices toward $70–71 (~Rs.2,51,000–2,55,000). On the other hand, a fall below $55 (~Rs.2,14,000) may drag it down to $50 (~Rs.2,00,000).
Support and Resistance
| International Gold Support Level International Gold Resistance Level Domestic Gold Support Level Domestic Gold Resistance Level | : $3900/oz : $4160/oz : Rs 137,000/10 gm : Rs 147,000/10 gm |
| International Silver Support Level International Silver Resistance Level Domestic Silver Support Level Domestic Silver Resistance Level | : $55/oz : $63/oz : Rs 214,000/kg : Rs 235,000/kg |


Precious Metals Bounce Back As Iran Ceasefire Hopes Rise, But Fed Rate Fears Loom: AUGMONT BULLION REPORT

Bvlgari Revives Its Iconic Gold & Steel Legacy With Bold New Jewellery Creations

Cosmos Diamonds Makes History With World’s First LGD Jewellery Launched Into Space

MCX Gold, Silver Futures For August Delivery Rise On Renewed Geopolitical Tensions
Precious Metals Bounce Back As Iran Ceasefire Hopes Rise, But Fed Rate Fears Loom: AUGMONT BULLION REPORT
Cosmos Diamonds Makes History With World’s First LGD Jewellery Launched Into Space
-
 National News8 hours ago
MCX Gold, Silver Futures For August Delivery Rise On Renewed Geopolitical Tensions
-
 International News4 hours ago
Precious Metals Bounce Back As Iran Ceasefire Hopes Rise, But Fed Rate Fears Loom: AUGMONT BULLION REPORT
-
 National News5 hours ago
Cosmos Diamonds Makes History With World’s First LGD Jewellery Launched Into Space
-

 International News8 hours ago
London Diamond Bourse Announces Launch Of Its New Coloured Gemstone Course