
International News
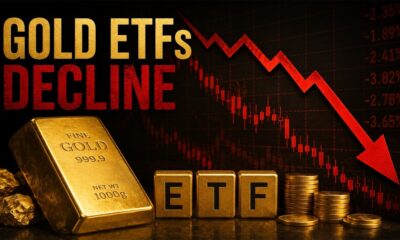
WGC Gold ETF commentary: Asia erupts as global momentum builds

April in review
Global physically backed gold ETFs1 added US$11bn in April, extending their inflow streak to five months (Table 1, p2).2 Supported by a higher gold price and continued inflows, global gold ETFs’ total assets under management (AUM) reached another month-end high of US$379bn. Meanwhile, holdings surged 115t to 3,561t, the highest since August 2022 and yet still 10% below the month end peak of 3,915t in October 2020.
Asia led inflows, accounting for 65% of the net global total – their strongest month on record. North American demand was also sizable while European flows flipped negative. Other regions continued to experience positive demand, albeit only mildly.
Highlights
Asia flows surged and North America also saw robust demand, while Europe witnessed mild outflows. The strongest inflow since March 2022 and the continued gold price surge pushed global gold ETFs’ AUM to US$379bn, 10% higher in the month. Global gold trading volumes rose significantly across all markets.
Regional overview
Asia experienced record breaking inflows during April, adding US$7.3bn, the strongest ever. The bulk of the demand came from China marking the third consecutive month of inflows and the strongest on record for the region. And more impressively, the April inflows have now surpassed those in Q1 and in full year 2024. In addition to the continued local gold price surge, demand was also driven by:
• The ongoing trade dispute with the US, which has raised fears of weaker growth, amplified equity volatility, and intensified expectations of the local currency depreciation
• Lower government bond yields, amid rising rate cut anticipations.
Global trade risks and the gold price surge also boosted gold ETF demand in Japan, their seventh consecutive month inflow. India also recorded steadily positive flows, following net outflows last month.
North American investors continued to buy gold ETFs, adding US$4.5bn in April. Although flows moderated compared to February and March, this month marked the second strongest April on record. And net cumulative flows through the first four months of the year have already outpaced 2020’s historical performance.
April and y-t-d 2025 regional flows* price momentum – albeit less pronounced compared to March – together with ongoing financial market turmoil amid trade policy uncertainties led investors in the region to gold.
Near-term momentum may ebb and flow, but expectations for continued market volatility – driven by concerns such as future trade policy and inflation – should provide a level of support to flows over the medium-to-long term.
Europe saw modest outflows of US$807mn in April, reversing course slightly. Outflows for the region were primarily concentrated in the UK, which were partially offset by inflows into Switzerland and France.
Nonetheless, the region witnessed healthy demand during most of April as the gold price rallied. Lower opportunity costs, fuelled by another rate cut from the ECB,3 and intensified expectations of a BoE reduction in early May 4 supported gold ETF buying. But late-month gold price declines sparked investor selling, likely profit-taking, erasing earlier gains. Sharp stock market rebounds may have further reduced gold’s appeal.
With the local currency strengthening against the dollar, FX hedged products, mainly in Switzerland, saw additional demand, curbing other outflows.
Funds in other regions posted their fifth consecutive month of positive demand (US$213mn) – Australia and South Africa continued to drive gold ETF inflows in the region.
Gold trading volumes boom
Global gold trading volumes across various markets rocketed in April, averaging US$441bn/day, 48% higher m/m. Amidst the strong gold price rally, all markets witnessed significant m/m rises in trading activities. LBMA OTC turnovers reached US$181bn/day, 31% higher m/m and notably higher than the 2024 average. Exchange-traded activities jumped by 67% compared to March, with the COMEX (+42% m/m) and the Shanghai Futures Exchange (+122% m/m) leading the charge. Although gold ETF trading volumes are smaller than other sectors, they saw the greatest m/m increase of all, surging 120%.
Total net longs of COMEX gold futures fell 30% m/m to 566t by the end of April. Net long positions held by money managers moved lower almost each week, reaching 360t by the end of the month and 35% below the 2024 average. This is mainly driven by a sharp decline in total longs – likely due to profit taking as gold refreshed new records – and a mild rise in shorts.


International News
De Beers Group Reports H1 2026 Production Surge
The company reported a significant increase in production volume while maintaining its full-year production target of 21 to 26 million carats.
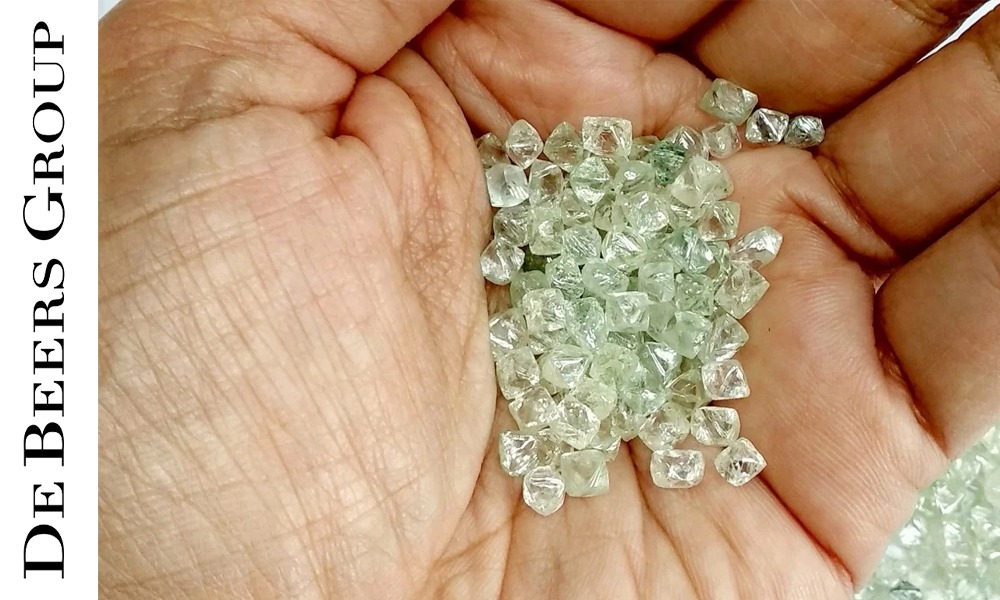
De Beers Group today released its operational and sales performance update for the second quarter and first half of 2026. Driven by strong recovery efforts and strategic access to higher-grade ore bodies, the company reported a significant increase in production volume while maintaining its full-year production target of 21 to 26 million carats.
Despite market pressures stemming from broader macroeconomic volatility, the company continues to advance operational streamlining and cost-optimization initiatives to ensure long-term resilience.
Key Highlights & Operational Summary
- Q2 Production Surge: Production jumped 88% year-on-year to 7.8 million carats in the second quarter, bringing total H1 output to 14.9 million carats (+46% YoY).
- Volume Growth: Consolidated H1 sales volume expanded 13% to 12.4 million carats (total sales volume up 20% to 14.8 million carats).
- Full-Year Guidance Reaffirmed: Full-year output remains targeted at 21–26 million carats, with second-half production planned to balance out via scheduled maintenance and a temporary operational pause at the Venetia mine.
- Resilient High-Value Demand: While entry-level categories faced broader pricing shifts, pricing for higher-value natural diamonds remained firm, providing baseline support to the overall index.
Market Dynamics & Strategic Response
Trading conditions during the first six months of 2026 reflected ongoing global macroeconomic uncertainties and regional conflicts that weighed on general consumer sentiment. Additionally, lower-value natural categories experienced continued pressure from lab-grown alternatives.
In response, De Beers actively adjusted its sales strategies, utilizing its inventory mix to meet existing market demand. While lower-value inventory sales shifted the average realized price to $105 per carat for H1, the company noted that underlying value indices for premium, higher-grade natural goods remained stable throughout the period.
Outlook & Portfolio Optimization
Looking ahead to the second half of 2026, De Beers will align production output directly with global demand signals. The anticipated surge from H1 will be offset by:
- The previously announced two-year operational pause at the Venetia mine.
- Planned facility maintenance at the Orapa and Jwaneng operations in Botswana.
Anglo American continues to execute its operational transformation and strategic divestment plans for De Beers, ensuring capital discipline and long-term organizational value.


-

 National News3 days ago
Akoirah by Augmont Celebrates The Family We Choose With A Thoughtfully Curated Friendship Day Gifting Edit
-

 New Premises1 day ago
GUZEMA Fine Jewelry Opens First U.S. Boutique In New York’s SoHo
-

 International News1 day ago
De Beers Group Reports H1 2026 Production Surge
-

 International News1 day ago
Canada Faces 50% US Import Tariffs; Gemstone Exemption Under Review