
International News
US private sector layoffs rise to a two-decade high AUGMONT BULLION REPORT

- Gold and silver prices are attempting to establish a base before the next upleg rise, following confirmation of supporting factors, including massive layoffs and the US government shutdown.
- In October, US challenger job losses tripled, marking the biggest increase in more than 20 years, as businesses cited a decline in customer demand. October saw 153,074 job cutbacks, up 183% from September and 175% from the same month the previous year. It has been the worst year for layoffs since 2009 and the worst amount for any October since 2003.
- A total of 1.1 million layoffs have been declared by companies this year, which is the most since the COVID-19 pandemic year of 2020 and a 65% increase from the previous year. The greatest number for a fourth-quarter month since 2008 was recorded in October.
- As the U.S. government enters its longest-ever shutdown, investors will be watching for any economic data from private sources while official data remains missing.
Technical Triggers
- Gold prices are expected to consolidate in the range of $3900 (~Rs 117,500) to $4060 (~ Rs 122,500) for the next few days, so buy on dips and sell on rallies.
- Silver prices are expected to consolidate in the range of 45.5(~Rs 140,000) and $49 (~Rs 150,000) for the next few days, so buy on dips and sell on rallies.
Support and Resistance
| Category | Support Level | Resistance Level |
|---|---|---|
| International Gold | $3900/oz | $4060/oz |
| Indian Gold | ₹117,500/10 gm | ₹122,500/10 gm |
| International Silver | $45.5/oz | $49/oz |
| Indian Silver | ₹140,000/kg | ₹150,000/kg |

International News
Candidates From India, China and The UAE Running For President Of The WFDB
The Election Reflects Power Shifts In The Trade As Well As Open Questions About The WFDB’s Character and Future.

Three candidates from India, China and the United Arab Emirates (UAE) are running for president of the World Federation of Diamond Bourses (WFDB) in an election that reveals contrasting approaches to the organization and the industry. s (WFDB) in an election that reveals contrasting approaches to the organization and the industry.
Bharat Diamond Bourse (BDB) vice president Mehul Shah, Shanghai Diamond Exchange (SDE) president Lin Qiang, and Dubai Diamond Exchange (DDE) chairman Ahmed Bin Sulayem have put their names forward ahead. Israel’s Yoram Dvash is standing down after completing the maximum two three-year terms.
The key theme is a split between preserving the federation’s traditional, experience-led model and pushing a younger, reform-minded approach.
Candidate positions
Mehul Shah is presented as the continuity candidate: he wants to strengthen the federation, add members, and restore its earlier influence, but he argues that younger leaders should first gain experience in junior roles.
Ahmed Bin Sulayem is linked with a reformist, younger-leaning camp that wants fresh leadership and modernization, with David Troostwyk and Molefi Letsiki on the same informal slate.
Lin Qiang’s role is more institutionally grounded, with recent WFDB and Shanghai ties showing China’s growing involvement in the federation’s outreach and industry strategy.
Industry context
The election is happening against broader concern about the WFDB’s relevance as lab-grown diamonds reshape the market and as influence shifts toward bodies like the World Diamond Council.
WFDB leadership tracker: track the Executive Committee, presidential election rules, and potential future candidates from India, China, and the UAE.


-

 New Premises4 hours ago
VBJ Celebrates Its Silver Legacy With A New Silver Showroom In Chennai
-

 National News2 hours ago
MCX Gold, Silver Surge On Escalating Geopolitical Tensions
-

 Appointment4 hours ago
Mehul Shah Elected President World Federation Of Diamond Bourses (WFDB)
-
 TechBuzz5 hours ago
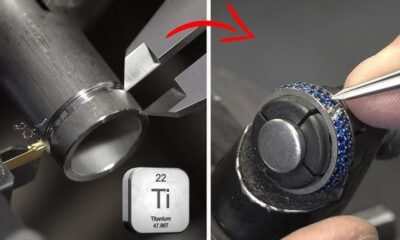
The Titanium Jewellery Manufacturing:Convergence Of Advanced Manufacturing, AI, and Surface Chemistry