
International News
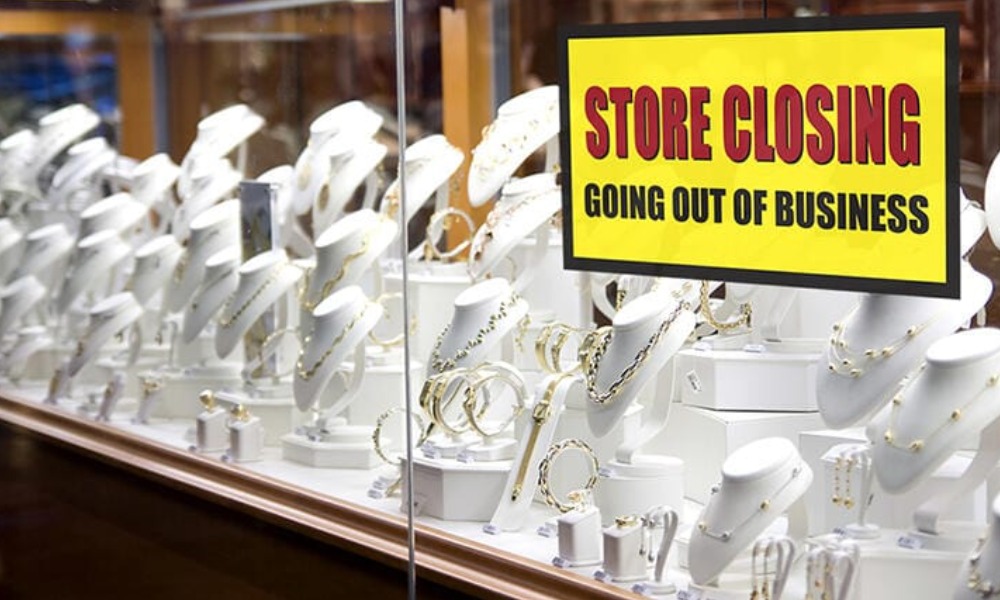
Despite business closures, jewellery industry shows signs of steadying; JBT
Hundreds more US jewelry businesses ceased trading in Q3, according to the latest update from the Jewelers Board of Trade (JBT), which provides commercial credit information.
The rate of decline remains steady, with the total number of registered retailers, wholesalers and manufacturers down by 3.1 per cent, as it was in Q2, and largely in line with recent quarters.
Ongoing uncertainty around major trade relationships and supply chain risks continued to impact business sentiment. Still, there were signs of measured progress for the jewelry industry.
In the three months to 30 September the number of jewelry businesses fell by 706 to a total of 22,858. That takes account of new businesses as well as ceased operations.
There were 89 new listings during Q3 2025, compared to 112 in Q3 2024, a drop of a fifth. But there were also 100 closures, down a quarter on 136 in Q3 2024.
Overall there were 93 fewer manufacturers, a reduction of 4.2 per cent to 2,096; 96 fewer wholesalers, a reduction of 2.9 per cent to 3,234; and 517 fewer retailers, a reduction of 3.0 per cent to 16,822, according to JBT’s Vital Statistics and Trend Data, published on 4 December.
Although this year may have seen concerning shifts at times economically, the jewelry industry shows signs of steadying according to JBT.

International News
Candidates From India, China and The UAE Running For President Of The WFDB
The Election Reflects Power Shifts In The Trade As Well As Open Questions About The WFDB’s Character and Future.
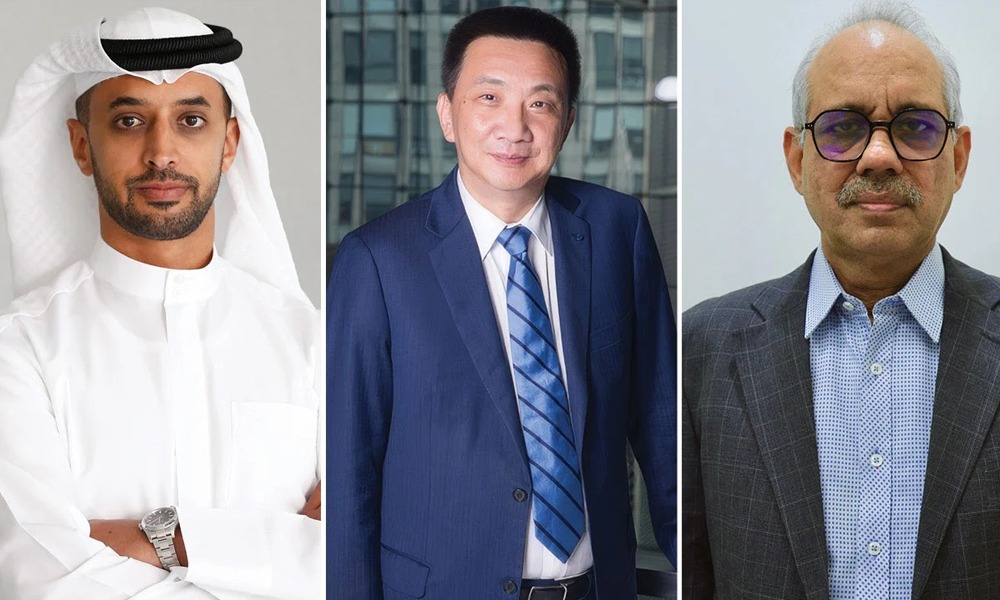
Three candidates from India, China and the United Arab Emirates (UAE) are running for president of the World Federation of Diamond Bourses (WFDB) in an election that reveals contrasting approaches to the organization and the industry. s (WFDB) in an election that reveals contrasting approaches to the organization and the industry.
Bharat Diamond Bourse (BDB) vice president Mehul Shah, Shanghai Diamond Exchange (SDE) president Lin Qiang, and Dubai Diamond Exchange (DDE) chairman Ahmed Bin Sulayem have put their names forward ahead. Israel’s Yoram Dvash is standing down after completing the maximum two three-year terms.
The key theme is a split between preserving the federation’s traditional, experience-led model and pushing a younger, reform-minded approach.
Candidate positions
Mehul Shah is presented as the continuity candidate: he wants to strengthen the federation, add members, and restore its earlier influence, but he argues that younger leaders should first gain experience in junior roles.
Ahmed Bin Sulayem is linked with a reformist, younger-leaning camp that wants fresh leadership and modernization, with David Troostwyk and Molefi Letsiki on the same informal slate.
Lin Qiang’s role is more institutionally grounded, with recent WFDB and Shanghai ties showing China’s growing involvement in the federation’s outreach and industry strategy.
Industry context
The election is happening against broader concern about the WFDB’s relevance as lab-grown diamonds reshape the market and as influence shifts toward bodies like the World Diamond Council.
WFDB leadership tracker: track the Executive Committee, presidential election rules, and potential future candidates from India, China, and the UAE.


Kalyan Jewellers Announces Sara Ali Khan as Brand Ambassador

Kerala Chief Minister’s Presence Marks Grand Finale Of KJIF 2026 As State’s Jewellery Industry Charts New Growth Vision

Say It with Candere: Jewellery Picks Inspired By Smriti Mandhana’s Effortless Style For Every Celebration and Everyday Moment

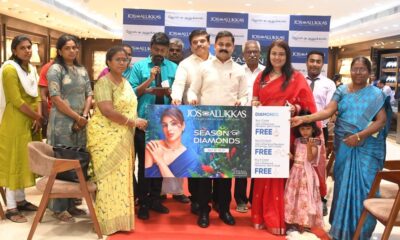
Jos Alukkas Announces ‘Season Of Diamonds’ Campaign
Say It with Candere: Jewellery Picks Inspired By Smriti Mandhana’s Effortless Style For Every Celebration and Everyday Moment
Kalyan Jewellers Announces Sara Ali Khan as Brand Ambassador
-
 BrandBuzz18 hours ago
Jos Alukkas Announces ‘Season Of Diamonds’ Campaign
-
 National News17 hours ago
Say It with Candere: Jewellery Picks Inspired By Smriti Mandhana’s Effortless Style For Every Celebration and Everyday Moment
-
 GlamBuzz16 hours ago
Kalyan Jewellers Announces Sara Ali Khan as Brand Ambassador
-
 National News17 hours ago
Kerala Chief Minister’s Presence Marks Grand Finale Of KJIF 2026 As State’s Jewellery Industry Charts New Growth Vision